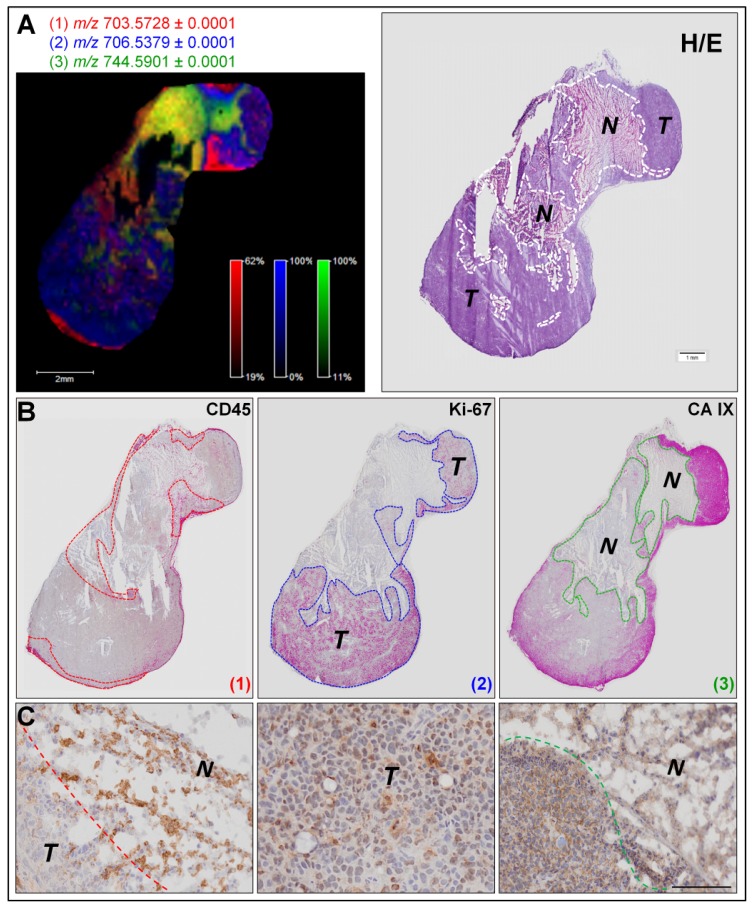
Figure 3.
Determination of low-abundant PL species associated with different tumor compartments by correlation between MALDI MSI data and histochemical stainings. (A) MALDI MSI ion image representing the localization of three PLs (m/z values of 703.5728 in red, 706.5379 in blue, and 744.5901 in green) in a section of tumor induced by MDA-MB-435 cells (right panel) and hematoxylin/eosin staining (left panel). Dotted lines on the hematoxylin/eosin stained section image delineate necrosis “N” and tumor “T” areas; (B) Binary images of CD45 (left panel), Ki-67 (central panel) and CA IX (right panel) immunostainings of MDA-MB-435 serial tissue sections. Dotted lines of each binary image delineate the localization of PL (1) (m/z 703.5728 in red); PL (2) (m/z 706.5379 in blue) and PL (3) (m/z 744.5901 in green) shown in ion image. Squares indicate positions of high magnification microscopy images of immunohistochemistry (C); and (C) High magnification microscopy images of immunohistochemistry for CD45 (left), Ki-67 (middle) and CA IX (right) immunostainings (scale bars, 500 μm).

