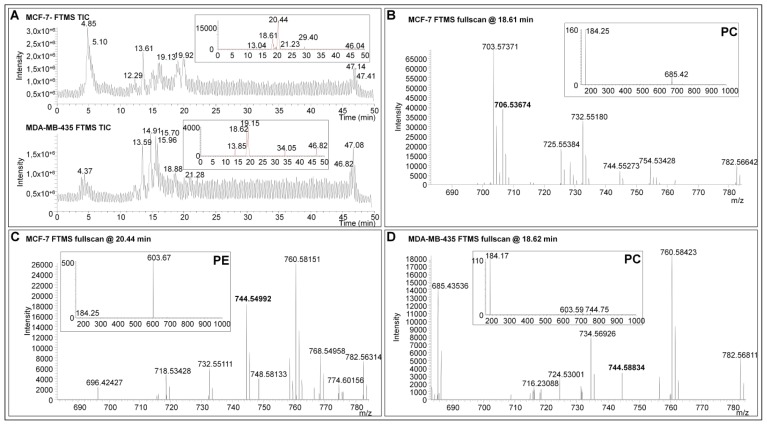
Figure 5.
LC-ESI-MS analyses of lipid extracts from MCF-7 and MDA-MB-435 tissues. (A) Total ion currents (TIC) of LC-ESI-MS analyses. Insets show the extract ion currents ranging from m/z 744 to 745; and (B)–(D): Exact mass measurements acquired with the FTICR analyzer. Insets show MS/MS spectra at respective retention times. The visualization of an ion at m/z 184 indicates that the PL is a PC. Neutral loss fragment of 141 Da indicates that the PL is a PE.

