Figure 5.
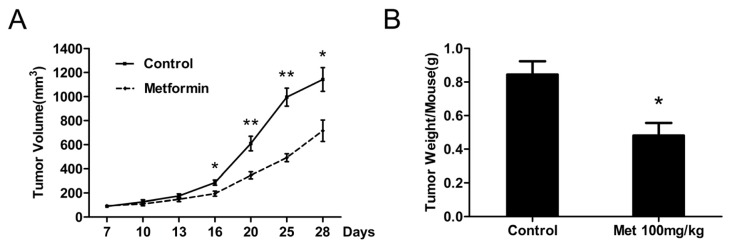
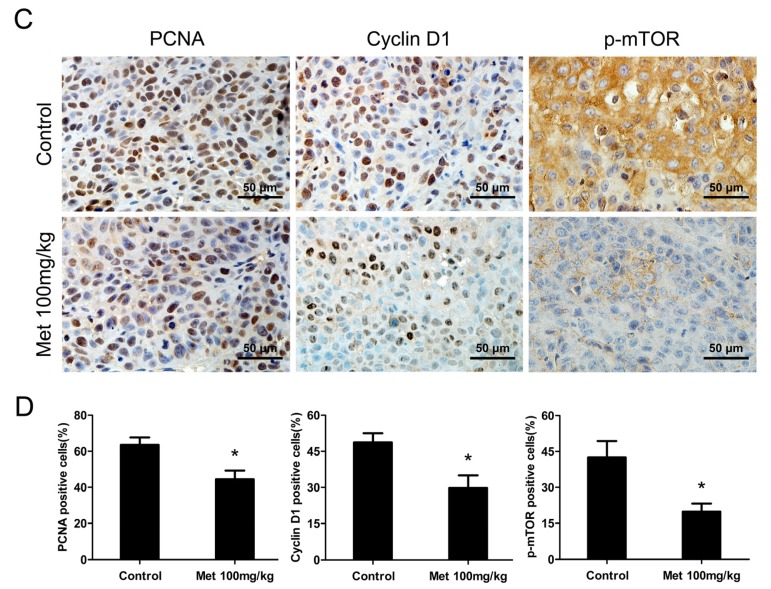
In vivo antitumor effects of metformin on bladder cancer xenograft model. Xenografts were generated by implantation of 2 × 10⁶ cells of 5637 cells subcutaneously into the right flanks of nude mice. When the tumors reached a mean diameter of 6 mm, the animals were randomized into control and treated groups (five mice per group). Metformin (Met, 100 mg/kg) was injected once daily intraperitoneally for three weeks, control mice received purified water only. (A) Graphs represent the average tumor volumes of 5637 xenografts in mice from the control and metformin-treated groups; (B) Weight of the excised tumors from the two groups; (C) Representative microphotograph of PCNA, cyclin D1 and p-mTOR staining on tumor sections from the control and metformin-treated groups. The scale bars equal 50 μm; and (D) Quantitative data for percentage of PCNA, cyclin D1 and p-mTOR positive cells in tumors from the two groups. Data, means of five mice in each group; bars, SEs. *p < 0.05 versus control; **p < 0.01 versus control.


