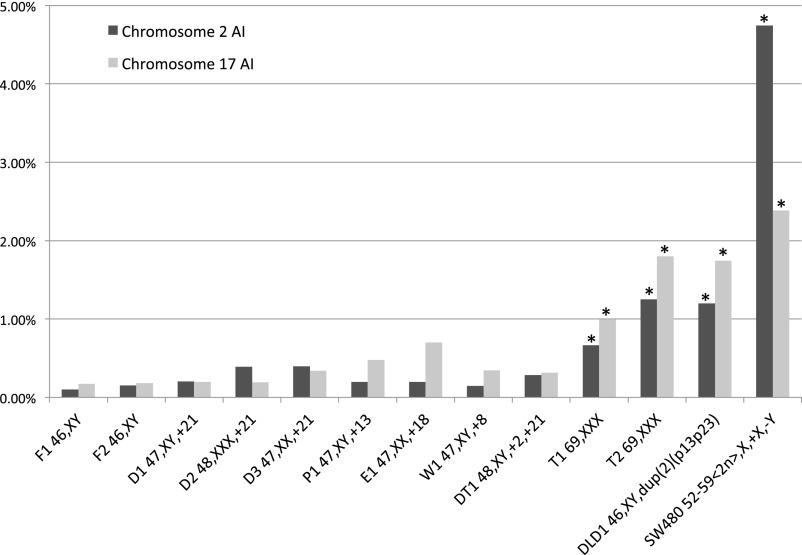
Fig. 1.
Aneusomy index for chromosomes 2 and 17 for all samples. P values are from Fisher’s exact test comparing each chromosome 2 and 17 in each aneuploid case with pooled data for the normal fibroblasts (F1 and F2). The Bonferroni correction was used to correct for multiple testing. *P < 0.001 after correction. See Table S3 for exact P values.

