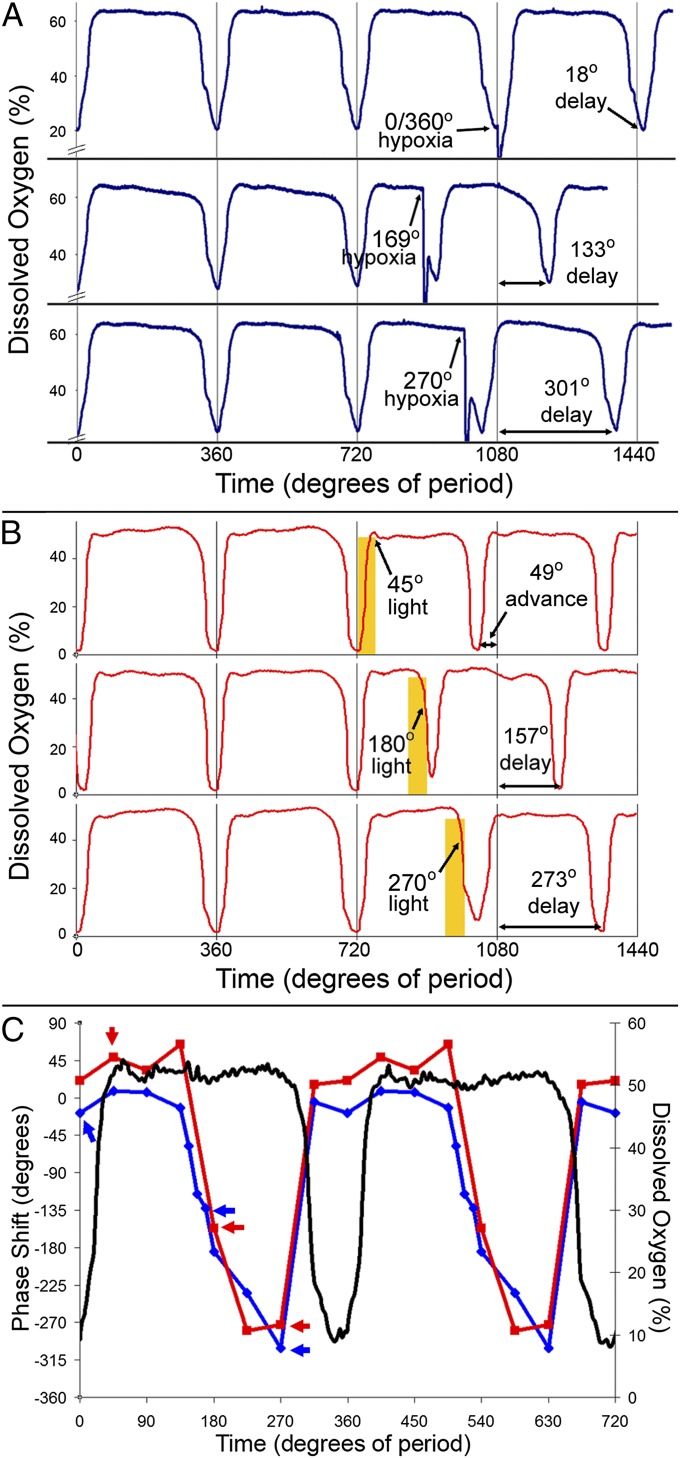
Fig. 4.
Phase responses of the YRO to treatment with hypoxia (by nitrogen gas) or visible light (600 µE⋅m−2⋅s−1). (A) Representative N2 treatments used to generate the hypoxia PRC in C. Single-headed arrows show phase at the end of the 3-min hypoxia treatment. Double-headed arrows show phase response. (B) Representative light treatments used to generate the light PRC in C. Yellow bars show time of treatment with 600 µE⋅m−2⋅s−1of CWF light. Single-headed arrows show phase at the end of the 30-min treatment. Double-headed arrows show phase response. (C) A double-plotted PRC to the endpoint of hypoxia (blue trace) or the endpoint of light (red trace) treatments. Phase shifts are plotted in degrees of period with advances plotted as positive values and delays as negative values. For coherence and comparison across the −180° phase mark, treatments between phases 135° and 315° were plotted as delays. A representative DO trace (black trace) shows the YRO for reference. Blue arrows show phase points from A. Red arrows show phase points from B. 0° was defined as the time when DO started to rise from the YRO trough. 360° = 3.3 h for the N2 PRC and 4 h for the light PRC.

