Fig. 3.
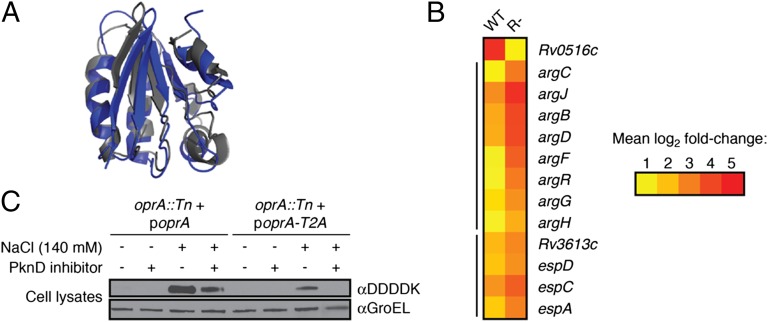
Rv0516c regulates transcription of osmotically activated genes and is regulated by PknD under osmotic stress. (A) The predicted protein fold of Rv0516c (gray) determined by the modeling program Phyre (47) using the crystal structure of the anti-anti–σ-factor SpoIIAA from B. subtilis (blue) as a template. (B) Heat map depicting the relative transcription of arg and Rv3616c-Rv3613c genes in WT and Rv0516c::Tn (R-) Mtb after treatment with 140 mM NaCl for 1 h. Changes in gene expression are relative to untreated WT or R- cells, respectively, and represent the average of four biological replicates (details in Materials and Methods). The mean fold change in expression of each gene (log2 scale) is indicated by the corresponding color. Yellow represents a twofold increase in expression. Red represents a 32-fold increase in expression. All changes in expression are statistically significant. Black bars to the left of the map denote probable operons. (C) Western blot analysis of OprA (Rv0516c) and a phosphorylation-deficient OprA mutant (oprA::Tn + poprA-T2A) after exposure to 140 mM NaCl and/or 60 µM PknD inhibitor (SP600125). GroEL was detected as a loading control.

