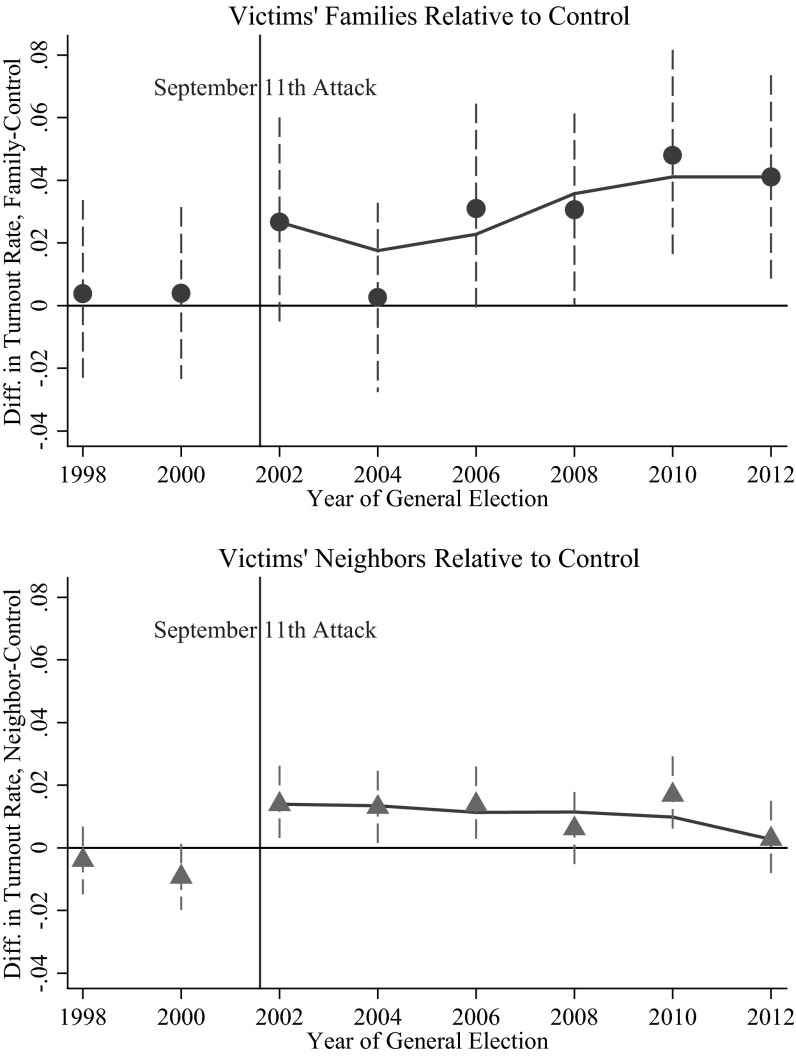
Fig. 1.
The effect of 9/11 on participation in general elections among victims’ families and neighbors. Each dot represents a difference of means between treatment and control groups, shown with a 95% confidence interval. Regression-based estimates of the treatment effects, with controls and clustered SEs, are shown in SI Text. A dot at 0.04 in the upper graph can be interpreted as meaning that 9/11 families voted at a rate 4 percentage points higher than their comparison group in a particular election. Of the pre-9/11 records matched to currently or formerly registered voters in the post-9/11 file, observation counts are 6,084 for family members (treatment and control) and 48,525 for neighbors (treatment and control).

