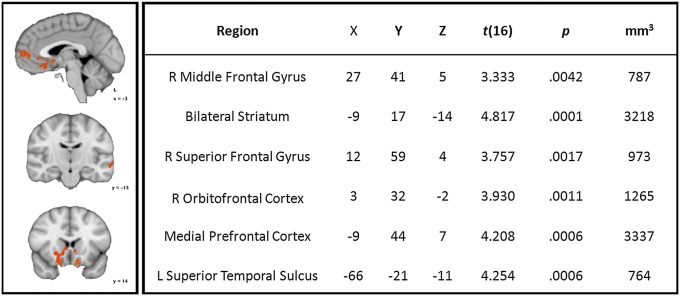
Fig. 2.
(Left) Orange map illustrates regions where activity was increased by OT vs. placebo during Eyes and Vehicles judgments (P < 0.05, corrected; K ≥ 729 mm3). L, left; R, right. (Right) Descriptive statistics and localization of peak responses from regions of OT > Placebo activity across Eyes and Vehicles judgments.

