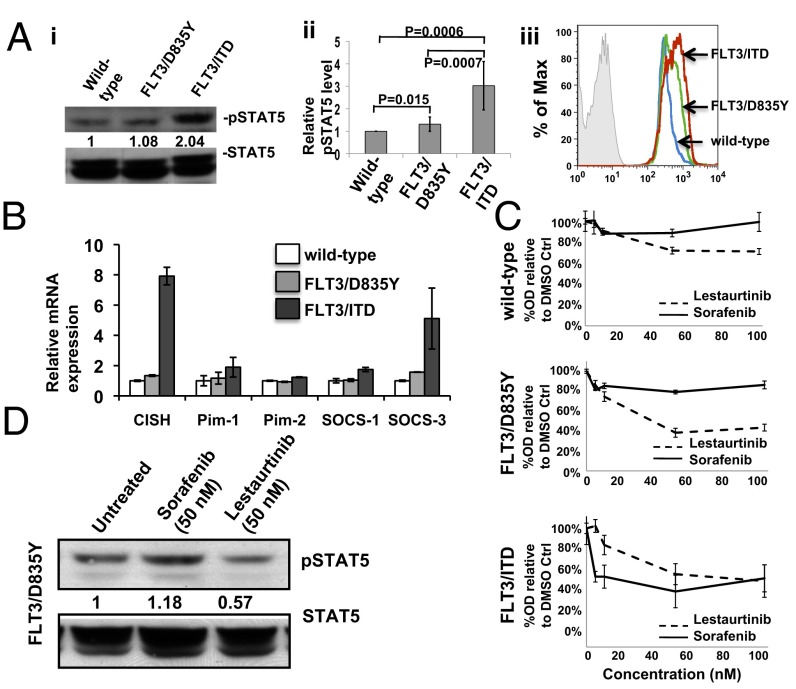
Fig. 5.
BM cells from FLT3/D835Y mice activate targets different from those of the FLT3/ITD mice. (A, i) Representative Western blot of phospho- and total Stat5 levels from Lin− BM. Ratios below the blot indicate quantization of relative level of phosphorylation normalized to total protein levels, as determined by densitometry, using QuantityOne densitometry analysis software. (A, ii) Graphical presentation of the relative phosph-STAT5 levels in Lin− BM cells shown by Western blot, as determined by densitometry (n = 7 independent mice and Western blots for each group). (A, iii) Representative flow cytometry analysis showing moderately elevated pSTAT5 level in sorted KSL cells from FLT3/D835Y mice. (B) Relative expression of some of the downstream targets of Stat5 signaling in Lin− BM cells, as determined by quantitative RT-PCR. Data are expressed as mean ± SEM (error bars). (C) Viability assay using whole BM from 6-mo-old mice. (D) Western blot of pStat5 and total Stat5 from Lin− BM cells from a 6-mo-old FLT3/D835Y mouse incubated for 1 h with either Sorafenib or Lestaurtinib, illustrating that pStat5 levels from FLT3/D835Y cells only respond to Lestaurtinib.

