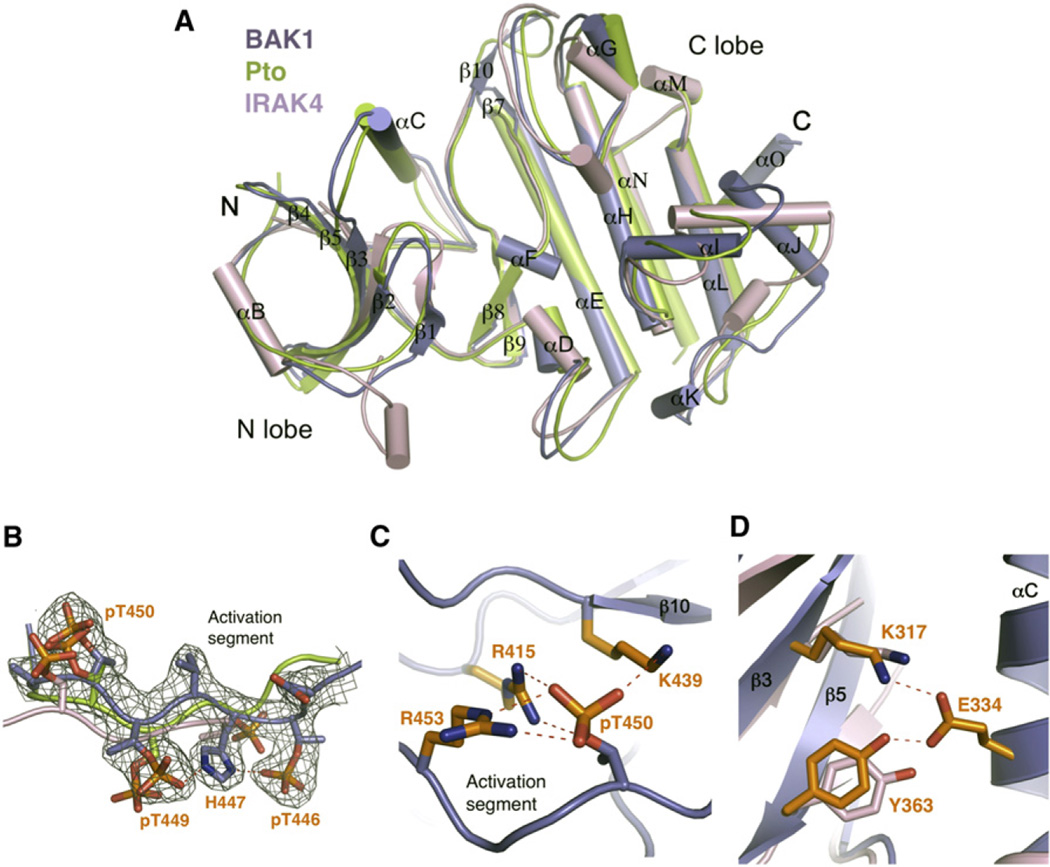
Figure 3. BAK1-KDBoundbyAvrPtoB250–359 Is in an Active Conformation.
(A) Structural comparison of BAK1-KD, Pto, and IRAK4. The coordinates of active Pto and IRAK4 were used for structural superimposition. The secondary structural elements in BAK1-KD are labeled. “N” and “C” represent the N termini and C termini, respectively. The color codes are as indicated.
(B) The activation segment of BAK1-KD adopts a similar conformation to those of Pto and IRAK4. Shown is superimposition of BAK1-KD, Pto, and IRAK4 activation segments. The electron density (2Fo–Fc) contoured at 1.2 σ around the activation segment of BAK1-KD is shown. The phosphorylated residues are displayed as sticks, and those from BAK1-KD are labeled.
(C) The phosphate group of pT450 in BAK1-KD forms ionic interactions with its neighboring basic residues.
(D) The conserved “tyrosine gate” in BAK1-KD and IRAK4 has a similar conformation. Shown is a close-up view of the structural comparison between BAK1-KD and IRAK4 around BAK1Tyr363. The side chains from BAK1-KD and IRAK4 are shown in orange and pink, respectively. Residues labeled are from BAK1-KD (see also Table S1).

