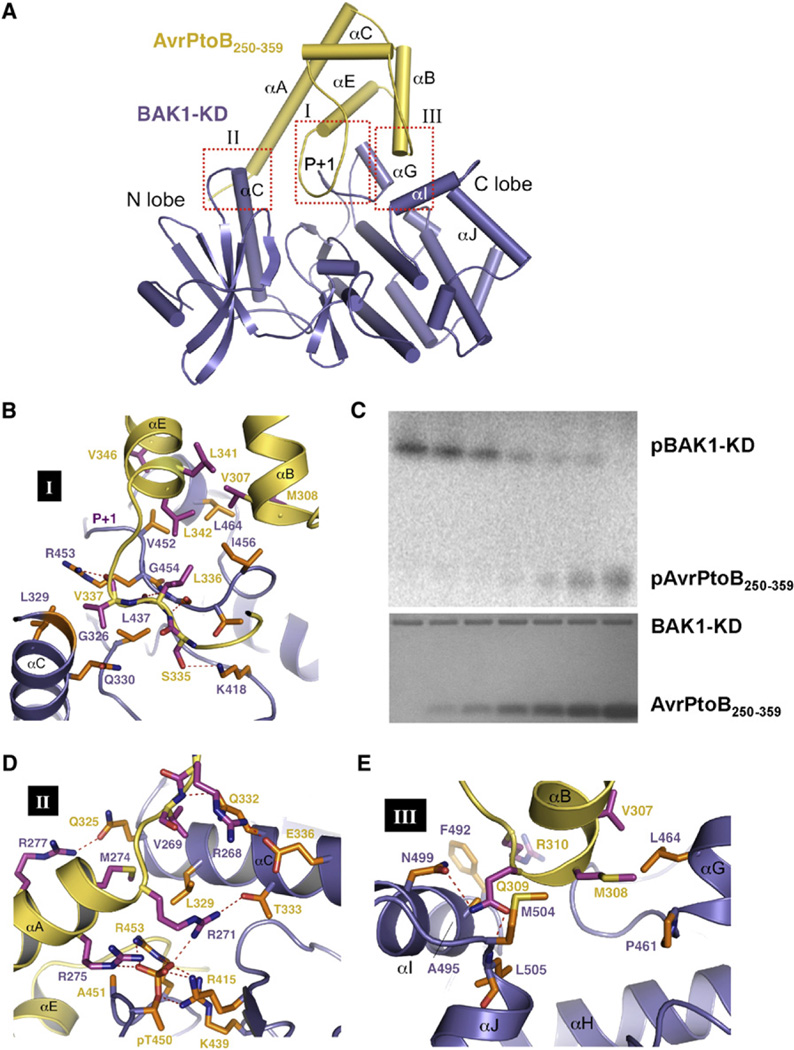
Figure 4. Specific Recognition of AvrPtoB by BAK1-KD.
(A) A cartoon representation of the overall structure of the AvrPtoB250–359-BAK1-KD complex. AvrPtoB250–359 and BAK1-KD are colored in yellow and purple, respectively. The three interfaces, I, II, and III, within the complex are highlighted in the red dashed frames. The P+1 loop of BAK1-KD is indicated. Some of the secondary structural elements in the BAK1-KD are labeled. (B), (D), and (E) show the detailed interactions of the interfaces I, II, and III in (A),respectively. The side chains from AvrPtoB250–359 and BAK1-KD are colored in orange and magenta, respectively. Relevant amino acid residues are numbered. Red dashed lines represent polar interactions. (C) AvrPtoB BID inhibits BAK1-KD kinase activity and is phosphorylated by BAK-KD in vitro. To determine the effect of the BID onBAK1 kinase activity, BAK1-KD autophosphorylation assays were performed in the presence of different concentrations of the BID (0, 2.17 µM, 4.34 µM, 8.68 µM, 17.36 µM, 119.5 µM, and 141.2 µM; bottom panel, Coomassie blue-stained gel). All reactions were incubated at 30 degrees for 30 min and terminated by adding an equal volume (50 ml) of 23× SDS buffer. SDS-polyacrylamide gel electrophoresis was used to fractionate proteins, and the phosphorylated BAK1 (pBAK1-KD) and AvrPtoB (pAvrPtoB250–359) were visualized with a phosphorimager (top panel) (see also Figure S2).

