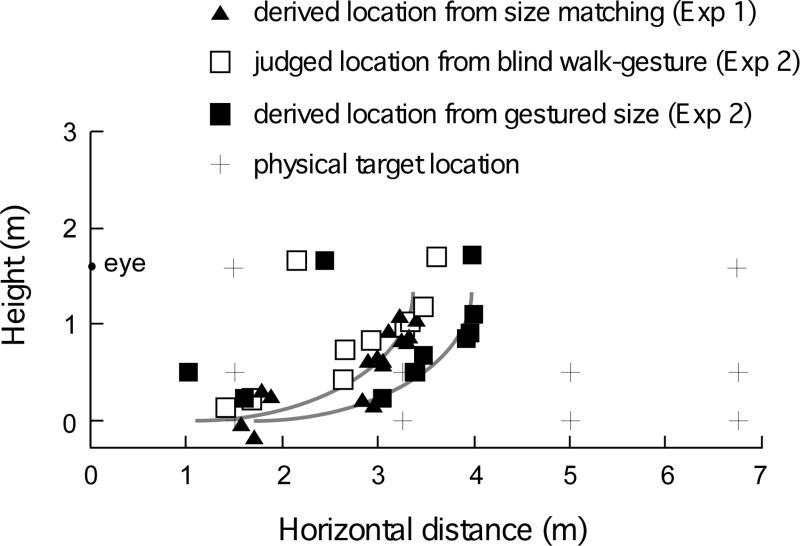
Figure 7.
Experiment 2: Comparing measured and derived judged locations. The graph plots the judged target locations from the blind walk-gesture height task, the derived target locations from the blind walk-gesture size task (sg) of Experiment 2 and from the perceptual size matching task (sm) of Experiment 1. The judged locations (open square) and derived locations from the perceptual size matching task of Experiment 1 (filled triangle) cluster together and is well fitted by the same intrinsic bias profile taken from figure 4. The derived locations from the blind walk-gesture size task (filled square) are also fitted by the intrinsic bias profile when shifted rightward.

