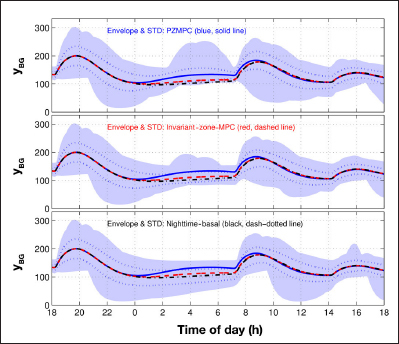
Figure 4.

Blood glucose (yBG mg/dl) mean trajectories, mean ± standard deviation, and minimum–maximum envelopes over 100 in silico adult subjects. Mean trajectories identical on each subplot: PZMPC (blue, solid), invariant-zone-MPC (red, dashed), and nighttime-basal (black, dash–dotted). Envelopes (blue area) and standard deviation (blue, dotted): PZMPC (top), invariant-zone-MPC (middle), and nighttime-basal (bottom). STD, standard deviation.
