
Figure 5.
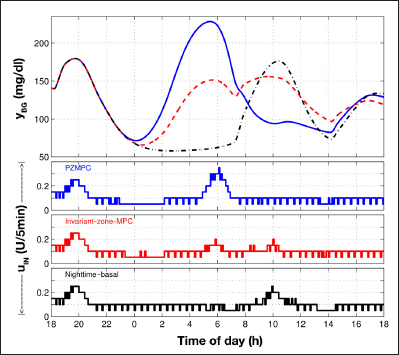
Simulation result. Top plot is blood glucose (yBG mg/dl): PZMPC (blue, solid), invariant-zone-MPC (red, dashed), and nighttime-basal (black, dash–dotted). Lower three plots are insulin input (uIN U/5 min): PZMPC (blue, top), invariant-zone-MPC (red, middle), and nighttime-basal (black, bottom). This in silico subject resulted in atypically large deviations between the contrasted control laws, and PZMPC resulted in higher total insulin delivery than invariant-zone-MPC and nighttime-basal strategies. (See AN ATYPICAL CASE and Table 1.)