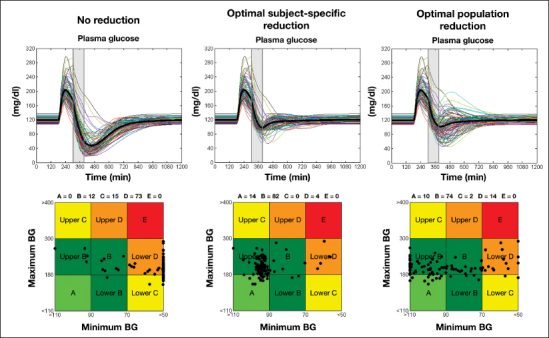
Figure 3.

Simulated plasma glucose concentrations (upper panel) and CVGA (lower panel) in the 100 T1DM virtual subjects: no basal insulin infusion rate adjustment (left panel), optimal combination of subject-specific adjustments (middle panel), and optimal combination of population (on average) adjustments (right panel). The shaded box represents the exercise period.
