
Figure 2.
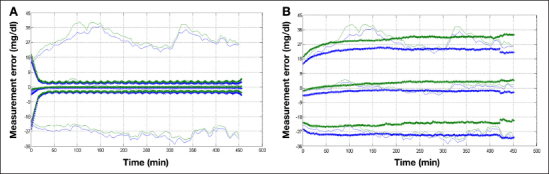
Visual predictive check representation of 10th and 90th percentiles, estimation of measurement error ê with τ variation effect (continuous line), and modelled error êM with different realizations (plus marker). Top panel (A) Comparison between the measurement error ê and the error model.25 Bottom panel (B) Comparison between the measurement error ê and the new error model.