
Figure 4.
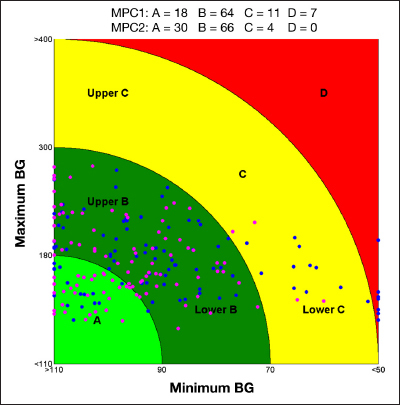
The CVGA representing the results obtained using MPC1 (blue) and MPC2 (magenta) on the nominal scenario. Each point represents the coordinates (x is a function of the minimal glucose value and y a function of the maximal value) associated with a single patient.