
Figure 6.
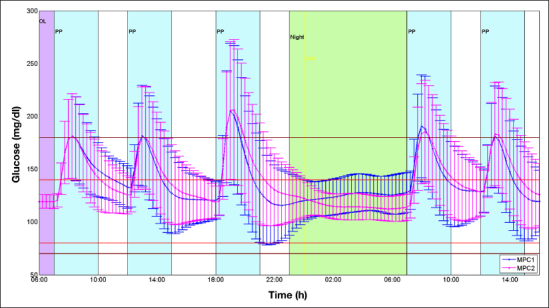
The figure shows for MPC1 (blue) and MPC2 (magenta) the mean (dots) and the variability (±standard deviation) of the glucose profiles obtained in 100 virtual patients with the meal variation scenario. OL, open loop; PP, postprandial period.