
Figure 3.
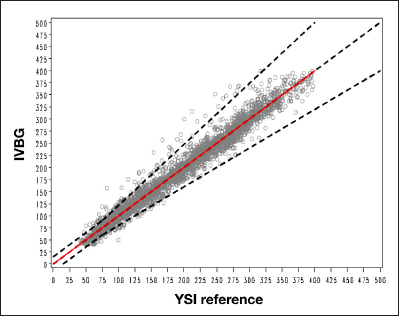
Ordinary least squares. The black dotted line indicates the 15/20% acceptance criteria. The red line represents the regression line. OLS root mean square error = 15.626814493; OLS slope = 0.9997129318; Intercept = 0.2067628554.
Official websites use .gov
A
.gov website belongs to an official
government organization in the United States.
Secure .gov websites use HTTPS
A lock (
) or https:// means you've safely
connected to the .gov website. Share sensitive
information only on official, secure websites.
Ordinary least squares. The black dotted line indicates the 15/20% acceptance criteria. The red line represents the regression line. OLS root mean square error = 15.626814493; OLS slope = 0.9997129318; Intercept = 0.2067628554.