
Figure 2.
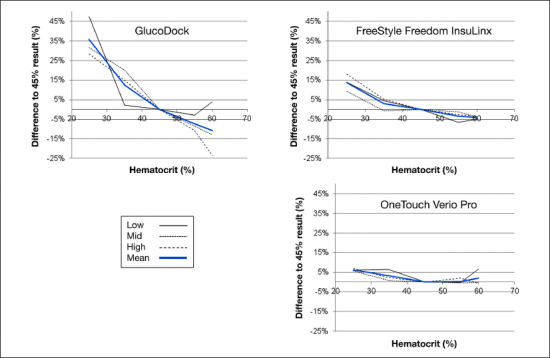
Results of the HCT interference experiment with GlucoDock, FreeStyle Freedom InsuLinx, and OneTouch Verio Pro. The graph shows the impact of different HCT levels on the readings at three different glucose concentrations (63–68, 141–145, 272–289 mg/dl). The bold line represents the mean value of all glucose levels. GlucoDock results were obtained with one strip lot only.