
Figure 3.
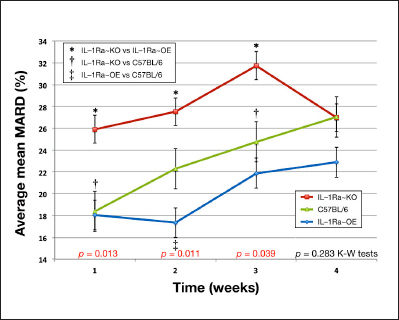
Impact of IL-1Ra expression on cumulative average mean MARD values from weeks 1 to 4 by IL-1Ra genetic background in a murine model of CGM. Cumulative average mean MARD from weeks 1 to 4 by IL-1Ra genetic background. * represents the statistical significance (p < .05) of the difference between IL-1Ra~KO and IL-1Ra~OE mean MARD values for that week. † represents the statistical significance (p < .05) of the difference between IL-1Ra~KO and C57BL/6 control mean MARD values for that week. ‡ represents the statistical significance (p < .05) of the difference between IL-1Ra~OE and C57BL/6 control mean MARD values for that week. Error bars present standard errors of the mean MARD for each individual week and genetic background. To test for statistical differences among all three genetic groups at once, Kruskal–Wallis (K–W) tests were conducted on the MARD values as a nonparametric equivalent to analysis of variance for each week.