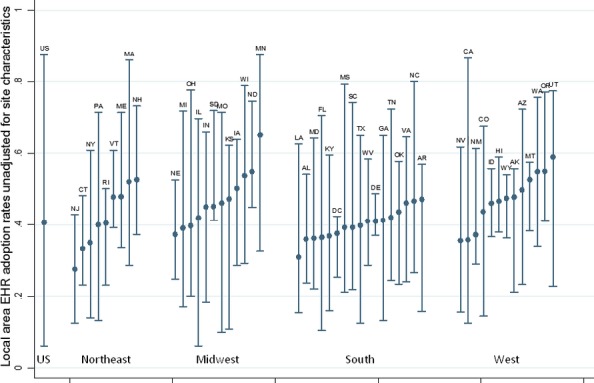
Figure 2.

Ranges in Local Area Electronic Health Record (EHR) Adoption Rates, U.S. Overall and by State
Note. Bars represent ranges and dots represent medians of local area EHR adoption rates within each state. Local area EHR adoption rates are the share of ambulatory physicians, physician assistants, and nurse practitioners in the Public Use Microdata Area (PUMA) (n = 2,068) with an EHR with e-prescribing functionality. Rates were calculated as the average predicted probability of EHR adoption across all providers in the PUMA based on a multilevel linear probability model including PUMA random effects and no covariates.
