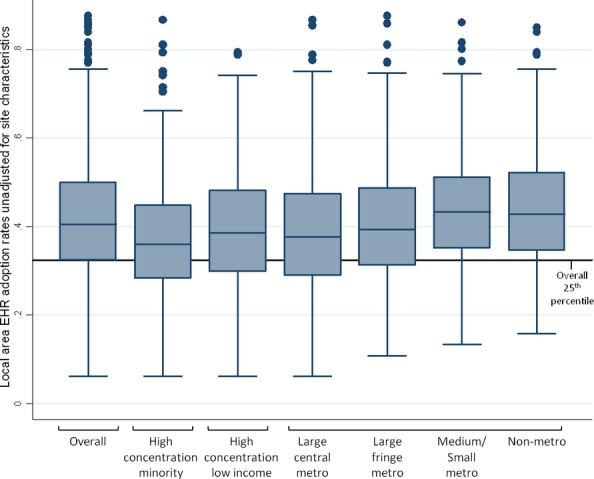
Figure 3.

Distribution of Local Area Electronic Health Record (EHR) Adoption Rates by Priority Population Characteristics
Note. Boxes represent inter-quartile ranges (25th to 75th percentile), horizontal lines inside boxes represent medians, vertical lines extending from boxes represent the range of values within 1.5 times the inter-quartile range, and dots represent values outside 1.5 times the inter-quartile range. Local area EHR adoption rates are the share of ambulatory physicians, physician assistants, and nurse practitioners in the Public Use Microdata Area (PUMA) (n = 2,068) with an EHR with e-prescribing functionality. Rates were calculated as the average predicted probability of EHR adoption across all providers in the PUMA based on a multilevel linear probability model including PUMA random effects and no covariates.
