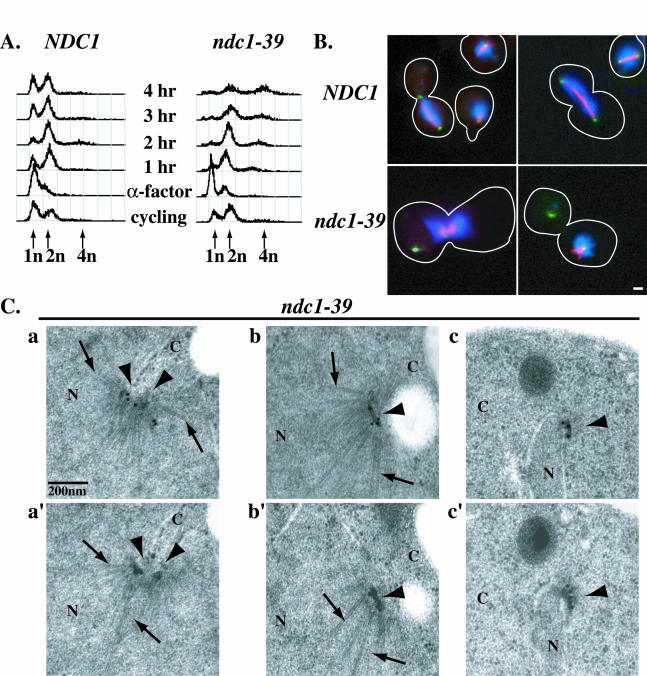
FIG. 3.
ndc1-39 cells fail in SPB duplication and DNA segregation at the restrictive temperature. (A) Cell cycle progression of NDC1 (strain 2804; left) and ndc1-39 (strain 3447; right) cells as monitored by flow cytometry. Log-phase (cycling) NDC1 and ndc1-39 cells grown in YPD medium were synchronized in G1 with α-factor at 23°C for 3 h and then released into the restrictive temperature of 35°C, and samples were taken every hour for 4 h. The x axis represents DNA content, and the y axis for each time point represents the number of cells in a population with a given DNA content. Pre (1n)-, post (2n)-, and endo (4n)-replication DNA peaks are indicated by arrows. Consistent with the mitotic arrest in ndc1-39 cells at 35°C at 3 h after α-factor release, 69% (n = 200) of ndc1-39 cells accumulated with a large-budded morphology, compared to 37% (n = 200) of NDC1 cells. NDC1 and ndc1-39 cells from the 2-h time point in panel A were examined by IF microscopy (B), and by IEM (C). Spc42p fused with GFP was used to identify SPBs. (B) Microtubules in NDC1 (top row) and ndc1-39 (bottom row) cells were labeled in red, DNA was labeled in blue, and SPBs were labeled in green (see Materials and Methods). The morphology of the cells is outlined in white. Bar, 1 μm. (C) Immunoelectron micrographs a and a′, b and b′, and c and c′ are images of two consecutive serial sections of ndc1-39 cells (strain 3448). b, b′, c, and c′ are images showing the two SPBs of one cell. SPBs (arrowheads) are immunolabeled and identified by a GFP antibody to Spc42p-GFP and a colloidal gold-conjugated secondary antibody. Examples of nuclear microtubules are indicated by arrows. N, nucleoplasm; C, cytoplasm. Bar, 0.2 μm.

