
Figure 3.
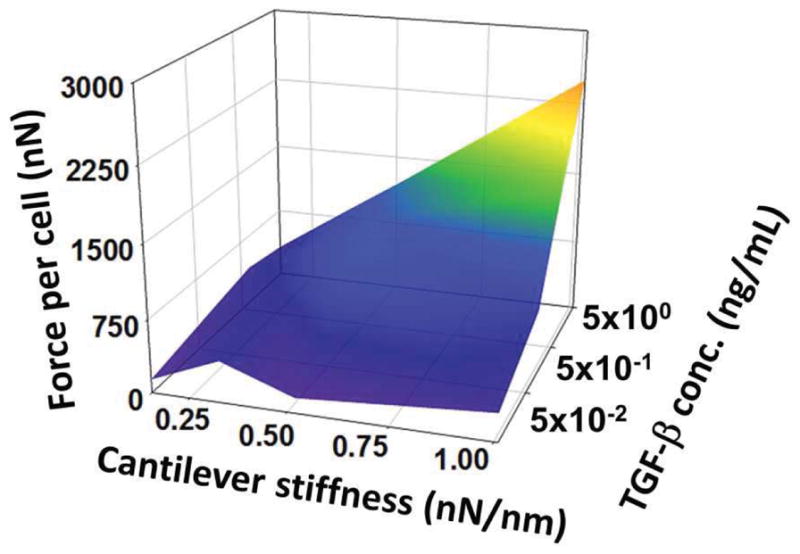
Response surface of force-per-cell values on 7th day for all groups (n=8–12 per group). Under the softest boundary (k = 0.15 nN/nm), increasing TGF-β1 concentration does not significantly affect homeostatic tension. Similarly, in the absence of TGF-β1, increasing boundary stiffness does not alter force-per-cell values. At higher levels, these factors interacted synergistically.