Figure 1.

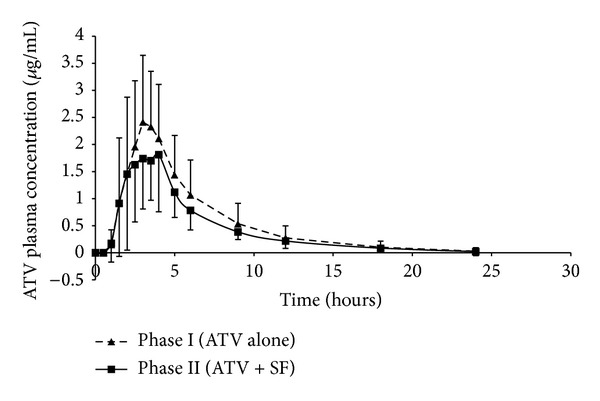
Comparison of ATV plasma concentration-time profiles for Phase I (ATV alone) and Phase II (ATV + SF). Each point represents the mean ± SD; n = 12.

Comparison of ATV plasma concentration-time profiles for Phase I (ATV alone) and Phase II (ATV + SF). Each point represents the mean ± SD; n = 12.