
Figure 2.
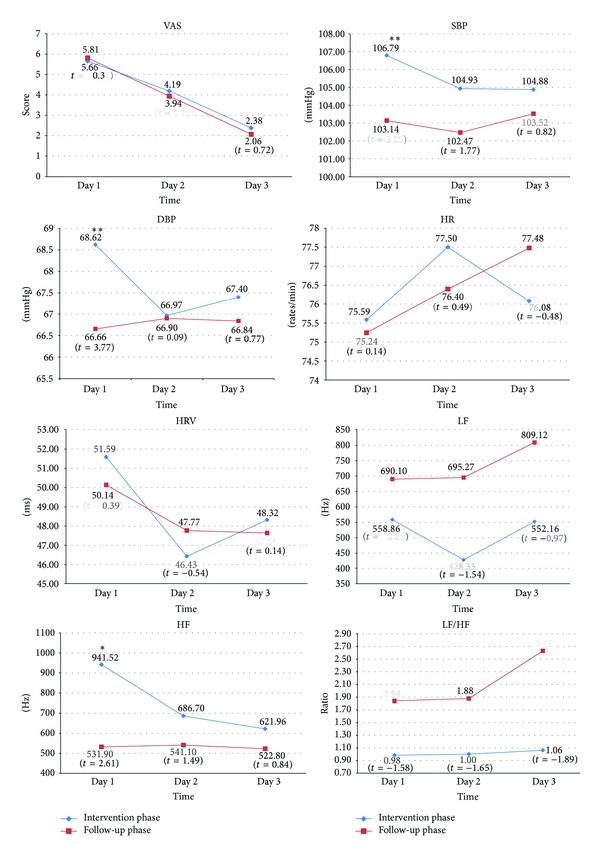
The comparison of VAS and physiological parameters on days 1–3, *P < 0.05, **P < 0.01.
Official websites use .gov
A
.gov website belongs to an official
government organization in the United States.
Secure .gov websites use HTTPS
A lock (
) or https:// means you've safely
connected to the .gov website. Share sensitive
information only on official, secure websites.
The comparison of VAS and physiological parameters on days 1–3, *P < 0.05, **P < 0.01.