
Figure 6.
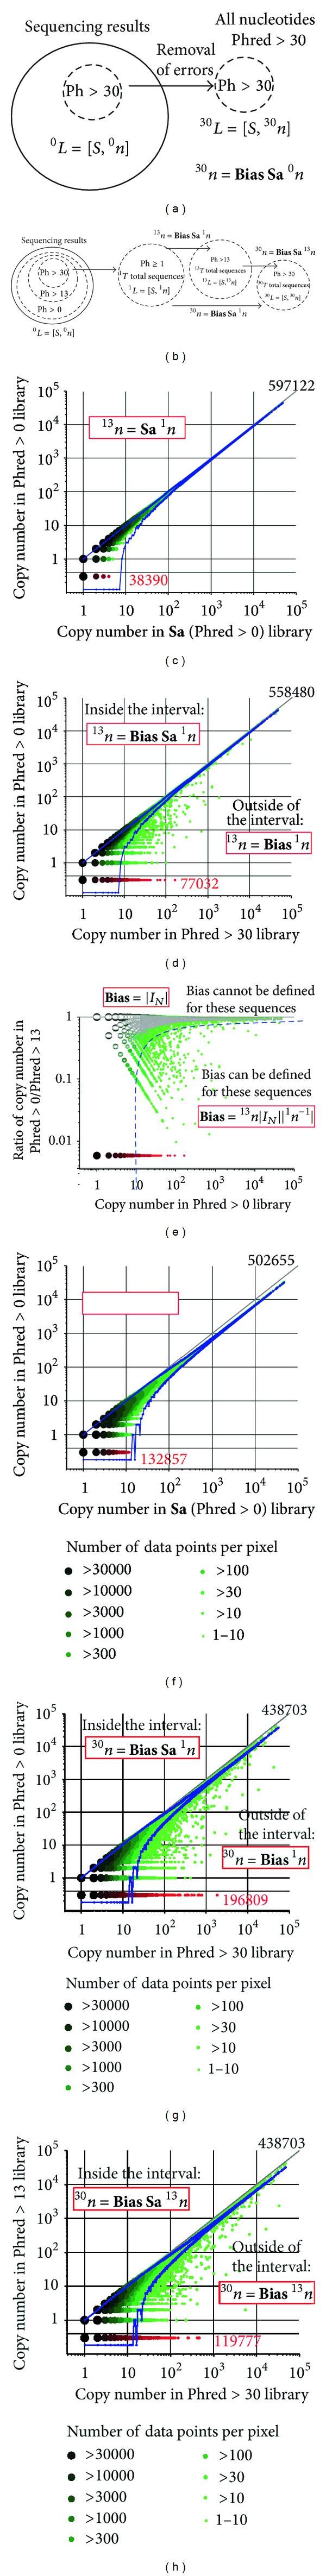
(a) Operator and multiset description of the error filtering procedure. Applying a Phred > 30 cutoff to library filtered by Phred>1 cutoff (1n) yields a subpopulation of the library (30n). If errors are sequence-independent, the 1n → 30n process should be identical to random sampling (30n = S a 1n). Any sequence-specific bias (B i a s) should be detected as deviation from S a 1n. (b) Progressive sampling with more stringent cutoff. (c) Theoretical S a 1n and theoretical 99.9% confidence interval (blue). (d) Observation of statistically significant deviation from S a operator: dots beyond the blue line represent sequences prone to bias. Red dots represent sequences that disappeared after in 1n → 30n process or during S a 1n sampling. (e) Magnitude of the bias range from 5 to 100-fold. (f) Bias in sampling of Phred > 30 data from Phred > 1 data ((f) is theory, (g) is observed). (h) Bias upon sampling of Phred > 30 data from Phred > 13. Many sequences were lost in this sampling and this loss was statistically significant beyond the 99.9% interval. This result shows that some sequences have propensity to harbor low- and medium-quality reads. Distribution of the errors is sequence specific.