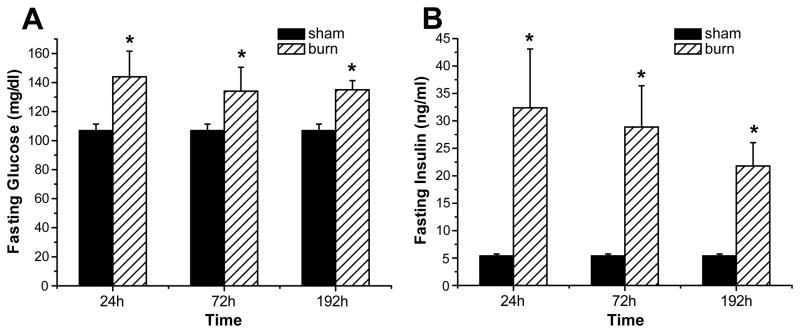
Figure 2. Hyperglycemia and hyperinsulinemia indicate insulin resistance following burn injury.
Fasting glucose (A) and fasting insulin levels (B) were determined at various time points post-burn. Throughout the figure, histograms depict serum concentrations of glucose or insulin at fasted levels. Results shown represent six different animals per group, as indicated in the main text. Bars represent means; error bars correspond to S.E.M. Asterisks denote statistical significance: p < 0.05 for every comparison between groups.

