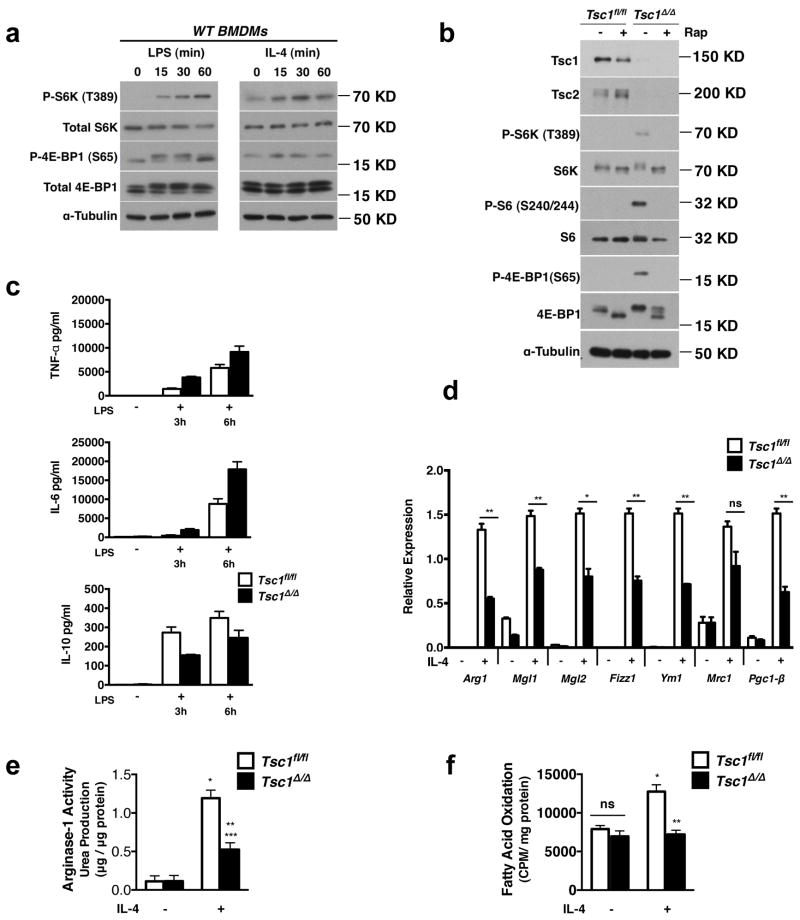
Figure 1. Tsc1Δ/Δ BMDMs Have Defective M2 Polarization and Enhanced Responses to LPS stimulation.
a. Immunoblot analysis of WT BMDMs stimulated with LPS or IL-4 for 15–60 min as indicated. b. Immunoblot analysis of lysates from Tsc1fl/fl and Tsc1Δ/Δ BMDMs treated with or without rapamycin for 15h. c. Measurement of TNF-α, IL-6, and IL-10 secretion by ELISA after treatment with LPS for 3h and 6h, (n=2 representative experiments). d. Expression of M2 genes in Tsc1fl/fl and Tsc1Δ/Δ BMDMs after treatment with IL-4 for 24h (n=3). *p<0.05, **p<0.01, ***p<0.001.e. Urea production normalized to total protein in Tsc1fl/fl and Tsc1Δ/Δ BMDMs stimulated as in (c), (n=4), *p<0.001 for untreated vs IL-4 for Tsc1fl/fl, **p<0.01 for IL-4 treated Tsc1fl/fl vs Tsc1Δ/Δ, ***p<0.05 for untreated vs IL-4 for Tsc1Δ/Δ. f. Fatty acid oxidation of 3H-palmitic acid presented as counts per minute normalized to mg of total protein after 36h treatment with IL-4, (n=3). *p<0.01 for untreated vs IL-4 in Tsc1fl/fl, **p<0.01 for IL-4 treated Tsc1fl/fl vs Tsc1Δ/Δ. Graphs are shown as mean ± SEM. P-values were determined using Student’s t-tests.

