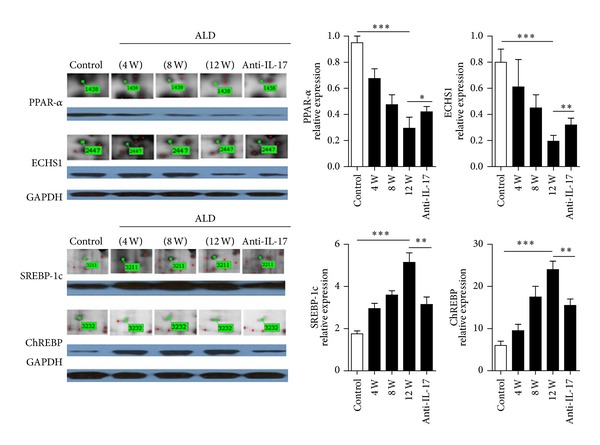
Figure 5.

Western blot validation of four selected proteins. Hepatic expression levels of sterol regulatory element-binding protein-lc (SREBP-1c), carbohydrate response element binding protein (ChREBP), enoyl-coenzyme A hydratase (ECHS1), and peroxisome proliferator-activated receptor alpha (PPAR-α) in the ALD and control groups. The results correlated well with the quantification of the DIGE images, which is also shown. The data indicate Mean ± SEM of five separate experiments. *P < 0.05; **P < 0.01; ***P < 0.001.
