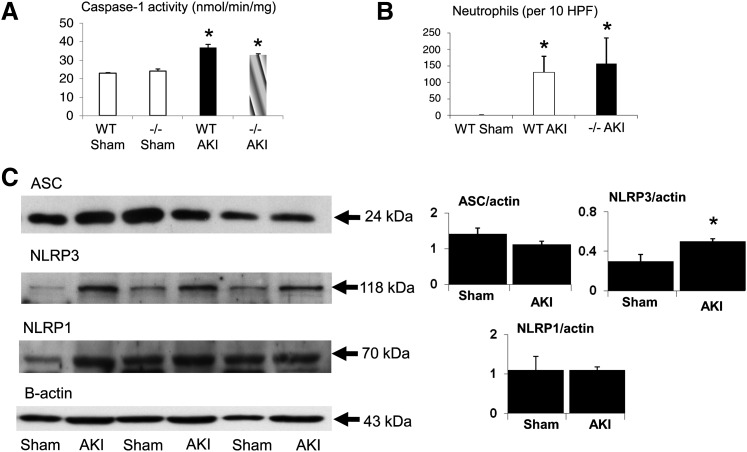
Fig. 7.
Caspase-1, neutrophil infiltration, ASC, NLRP1, and NLRP3 in ischemic AKI. (A) Caspase-1 activity was increased in ischemic AKI in both WT and NLRP3−/− (−/−) mice compared with sham-operated mice. n = 4 per group; *P < 0.05 vs. sham. (B) Neutrophil infiltration in the kidney was increased in ischemic AKI in both WT and NLRP3−/− (−/−) mice compared with sham-operated mice. n = 8 per group; *P < 0.05 vs. sham. (C) NLRP3, but not ASC or NLRP1, is increased in ischemic AKI. n = 4–6 per group. *P < 0.05 vs. sham. In densitometric analysis of immunoblots, data are presented as protein/β-actin ratios plotted on the y-axis. HPF, high-power field.

