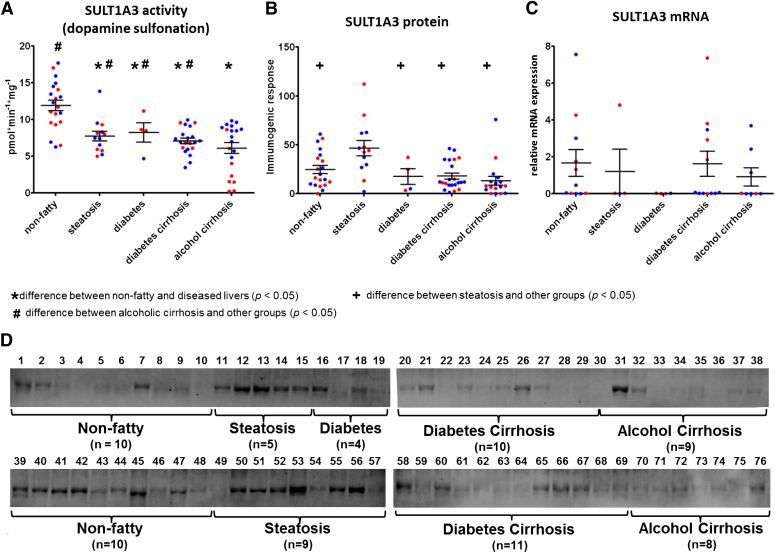
Fig. 4.
Expression and activity of SULT1A3 in nonfatty (control) and diseased human livers. Each data point represents a single tissue (average of determinations) categorized by gender and disease type (n = 20 for nonfatty; n = 13–14 for steatosis; n = 4 for diabetes; n = 21–22 diabetic cirrhosis; and n = 17–22 for alcohol cirrhosis). Tissue from female patients is displayed in red; from male patients, in blue. *Statistically significant differences (P < 0.05) between nonfatty and diseased livers. +Statistically significant differences (P < 0.05) between steatosis and other groups. #Statistically significant differences (P < 0.05) between alcoholic cirrhosis and other groups. (A) Enzyme activity was determined by incubating 10 μM dopamine with human liver cytosols for 30 minutes in the presence of the 35S-labeled cofactor PAPS. (B) Protein expression of SULT1A3 was quantified by Western blotting analysis in human livers. (C) Messenger RNA expression of SULT1A3 was quantified by quantitative real-time polymerase chain reaction using a Roche LightCycler 480 System (Roche Applied Science, Mannheim, Germany). (D) Membranes loaded with 40 μg protein and probed with anti-SULT1A3 antibody. Lane numbers refer to sample ID as noted in Supplemental Table 1.

