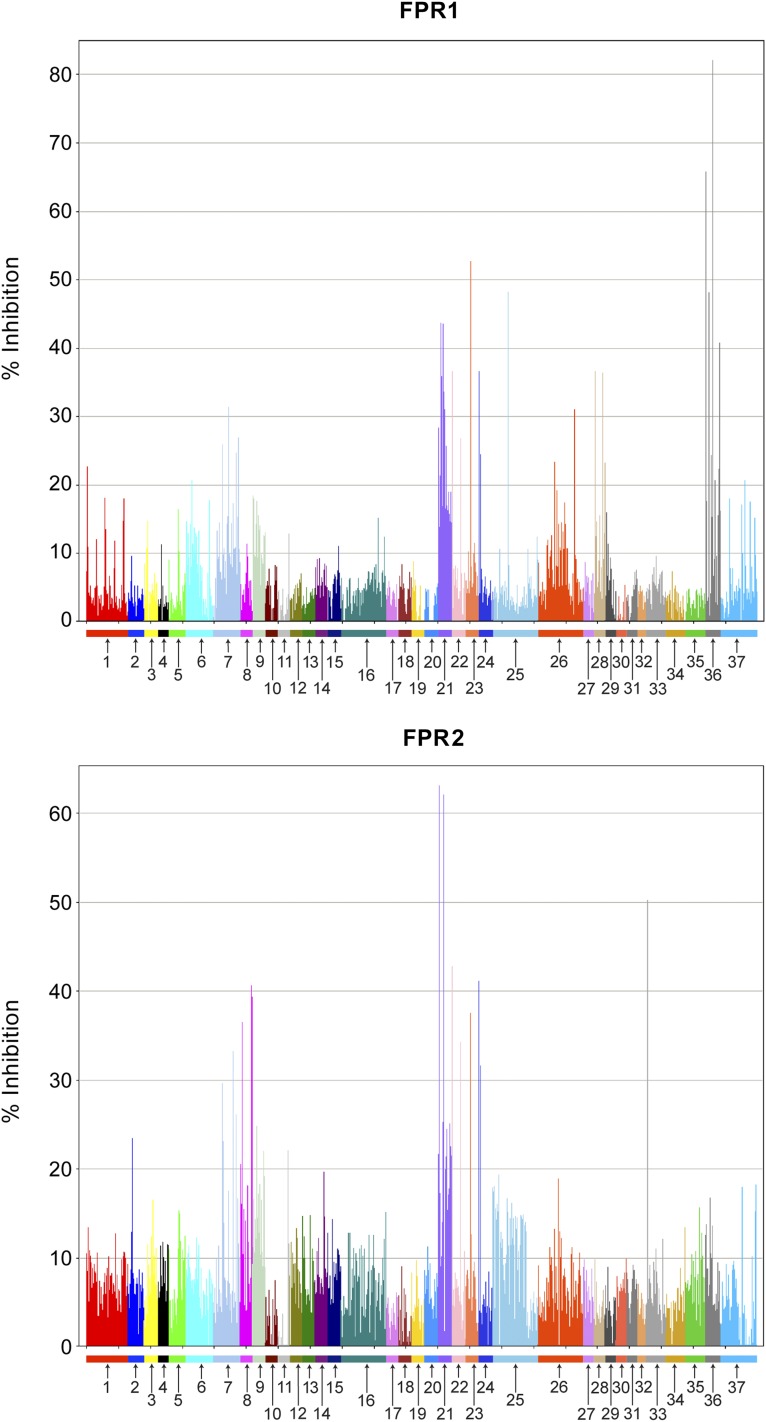
Fig. 1.
Activity profiles for FPR1 and FPR2 screened against 37 different mixture-based small-molecule libraries. Each library screened is numbered (see Supplemental Table 1 for library details) and color-coded, and each bar represents the activity (percentage of inhibition of labeled ligand binding to receptor) for a given mixture within each library.

