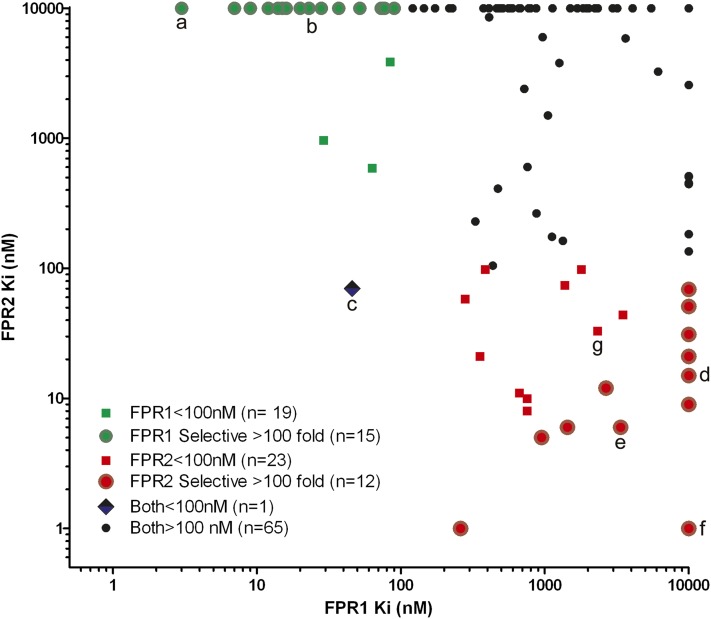
Fig. 2.
Scatter plot representation of 106 individual compounds derived from pyrrolidine bis-diketopiperazine library screened against FPR1 and FPR2. The activities (Ki) of each compound for each receptor are shown; their selectivity is denoted; and the number of compounds with different activities and selectivities are shown. See Supplemental Dataset 1 for structure and activity data on each compound. Data labeled a–g refer to compounds in Table 2 and Supplemental Fig. 1.

