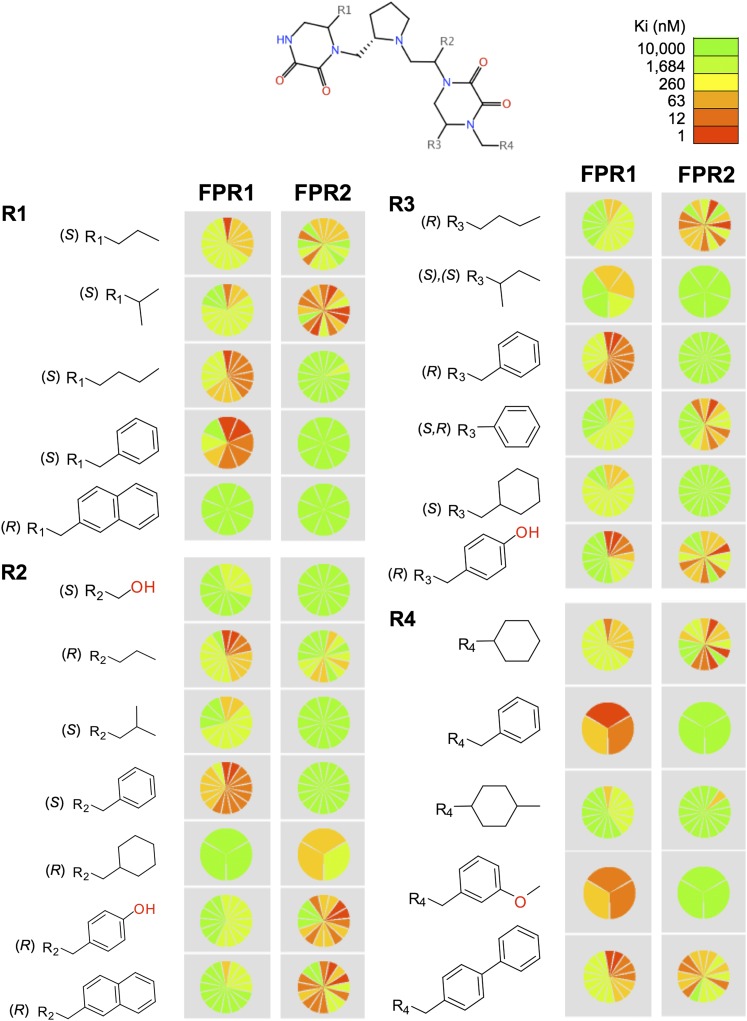
Fig. 3.
Visual representation of the SAR of 106 individual compounds screened against FPR1 and FPR2. The distribution of the activity (Ki) values for compounds containing an R-group is color-coded using a continuous scale from more active (red) to less active (green). The most populated R-groups, with three or more compounds, are shown. The number of compounds with a given substituent is represented with the number of slices in each pie. For visual clarity, the maximum number of slices shown is 16. The figure was generated with the Structure-Activity Report application of Molecular Operating Environment (version 2011.10; Chemical Computing Group Inc., Montreal, QC, Canada) (Clark and Labute, 2009).

