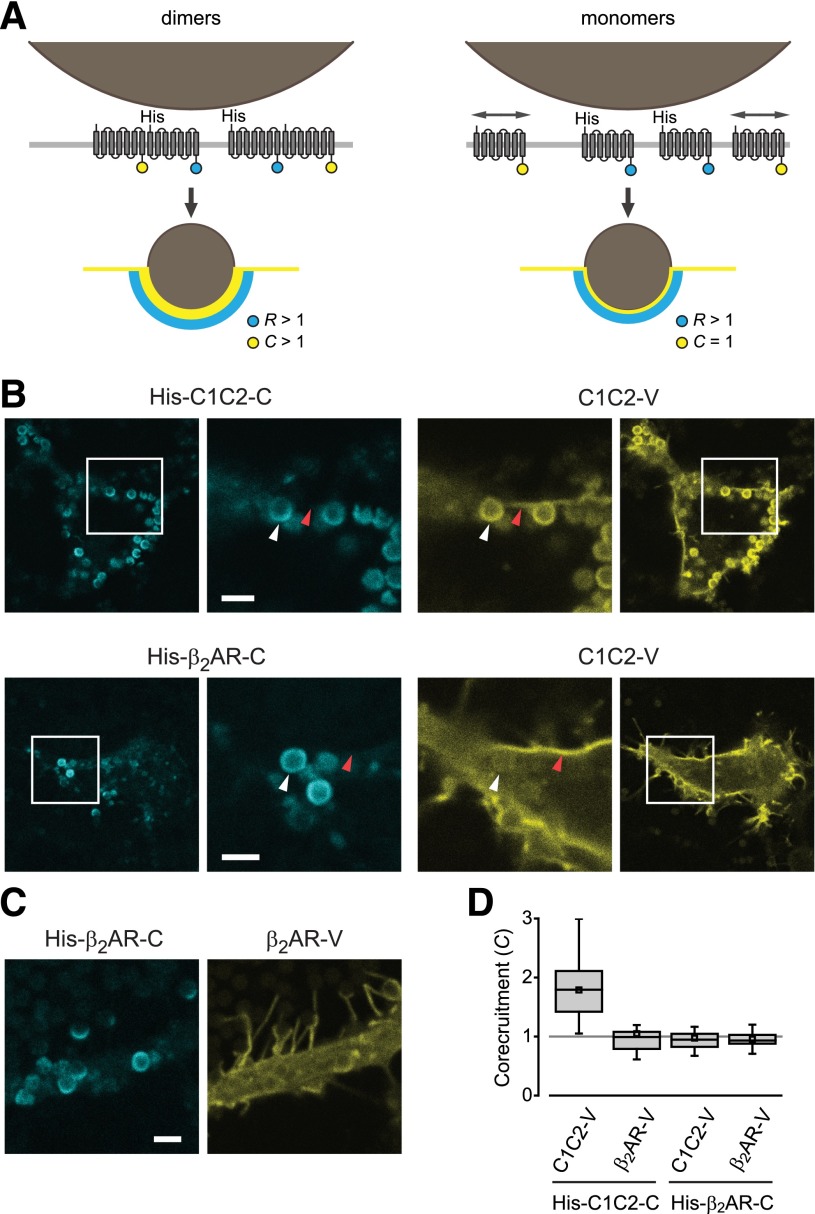
Fig. 2.
Corecruitment of C1C2 but not β2AR protomers to IMAC beads. (A) Stable dimers corecruit (C > 1) untagged protomers to IMAC beads (left), whereas monomers leave untagged protomers distributed throughout the surrounding plasma membrane (C = 1; right). (B and D) His-C1C2-C corecruits C1C2-V, but not β2AR-V to bead-associated regions (white arrowheads). Plasma membrane regions not apposed to IMAC beads (red arrowheads) are severely depleted of His-C1C2-C protomers. (C and D) His-β2AR-C does not corecruit β2AR-V to IMAC beads. Scale bars in B and C, 2 μm. In D, bars represent median, 25th, and 75th percentiles; small squares represent mean values; and whiskers represent minimum and maximum values.

