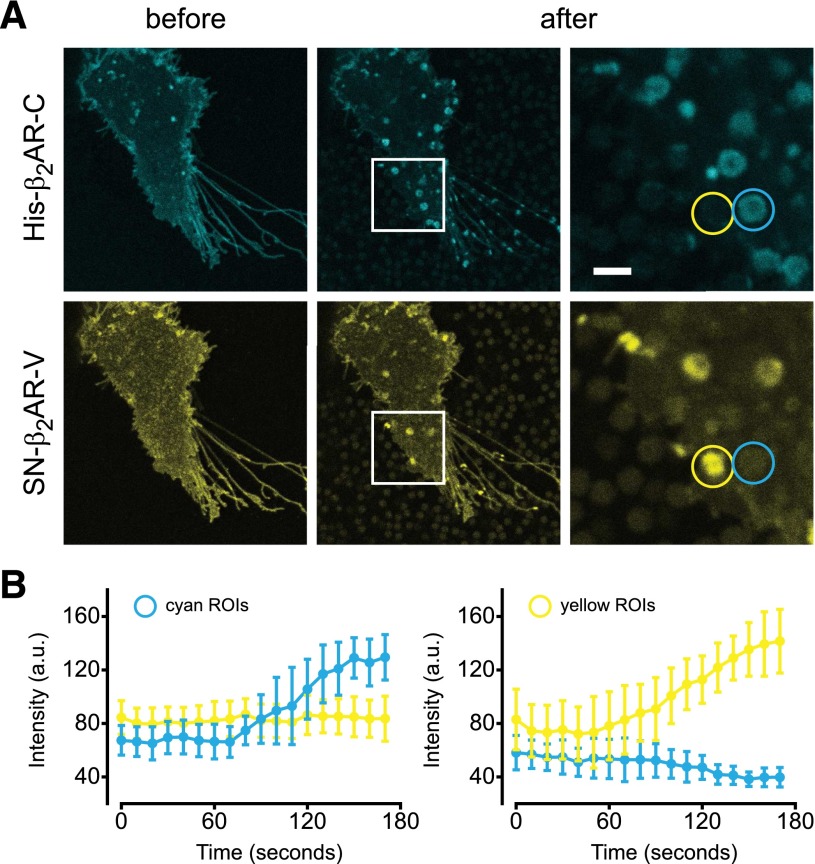
Fig. 4.
Segregation of His-β2AR-cerulean and SN-β2AR-venus by mixed IMAC and sAV beads. (A) Mixed IMAC and sAV beads are applied to cells expressing His-β2AR-C and SN-β2AR-V. Cyan and yellow ROIs are indicated; scale bar, 2 μm. (B) Development of cyan and yellow fluorescence over time in ROIs designated cyan or yellow. Beads are pipetted over cells at time = 30 seconds, and settle onto the cell surface over the next minute. Individual data points represent the mean ± S.D. of 15 cyan and 15 yellow ROIs from two cells.

