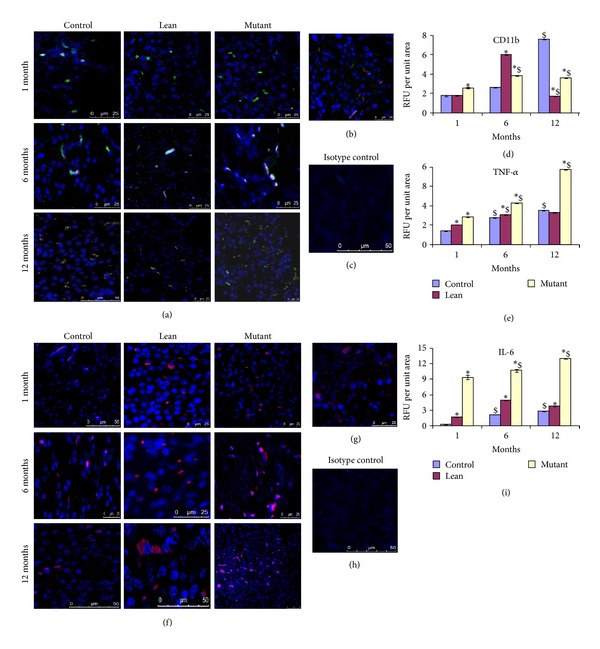
Figure 4.

Inflammatory stress responses. Immunofluoresence staining of pancreatic sections for inflammatory markers shown by colocalization (yellow) with macrophage marker CD11b (green) and proinflammatory cytokine for TNFα (red) shows more CD11b/TNFα colocalization with Mutant pancreas (a) compared to Lean and Control and comparable with (b) 24 months older in age Control; (c) represents its isotype control. (d and e) represent RFU for CD11b and TNFα, respectively, amongst phenotypes. Mutant pancreas also showed an increase in (f) IL-6, compared to its Lean and Control, and was similar to (g) 24-month Control; (h) represents isotype control and (i) RFU for IL-6 amongst phenotypes. An asterisk (*) represents significance (P < 0.05 by ANOVA) compared to Control and ($) indicates significance (P < 0.05 by ANOVA) compared to the same phenotype at 1 month.
