Figure 5.

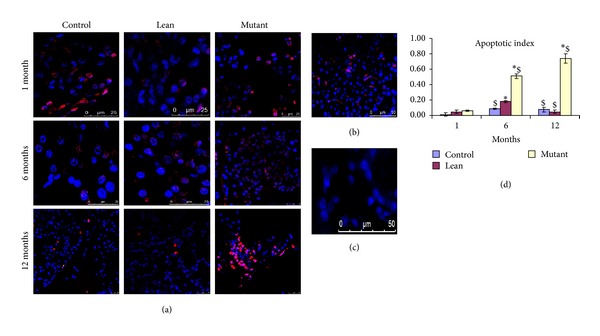
Apoptosis (TUNEL assay). Apoptosis detected by TUNEL assay shows red (pseudocolor) nuclei (counterstained with DAPI (blue). Mutants showed an increase in (a) apoptosis as compared to Lean and Control and apoptotic index (b) and it is comparable with 24-month-old Controls; (c) represent its negative control. Quantitatively, AI was significantly higher in (d) Mutants compared to Lean and Control and with age. Mean ± SE (n = 6). An asterisk (*) represents significance (P < 0.05 by ANOVA) compared to Control and ($) indicates significance (P < 0.05 by ANOVA) compared to the same phenotype at 1 month.
