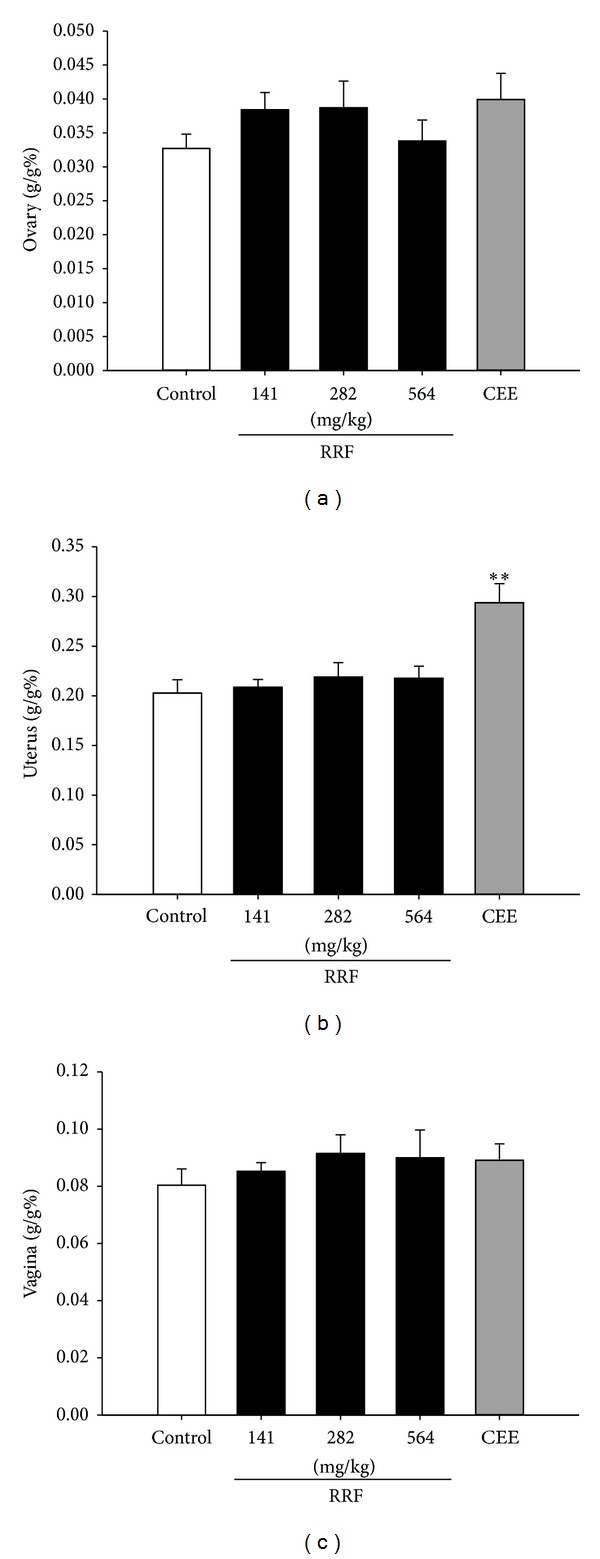
Figure 1.

Organ indexes of ovary (a), uterus (b), and vagina (c) in control group (blank bars), CEE group (0.1 mg/kg/d, dark-grey bars), and RRF groups (141, 282, and 564 mg/kg/d, solid-dark bars). Vertical bars represent standard errors of the means, where n = 8. Asterisks designate significant differences: *P < 0.05 versus control group and **P < 0.01 versus control group.
