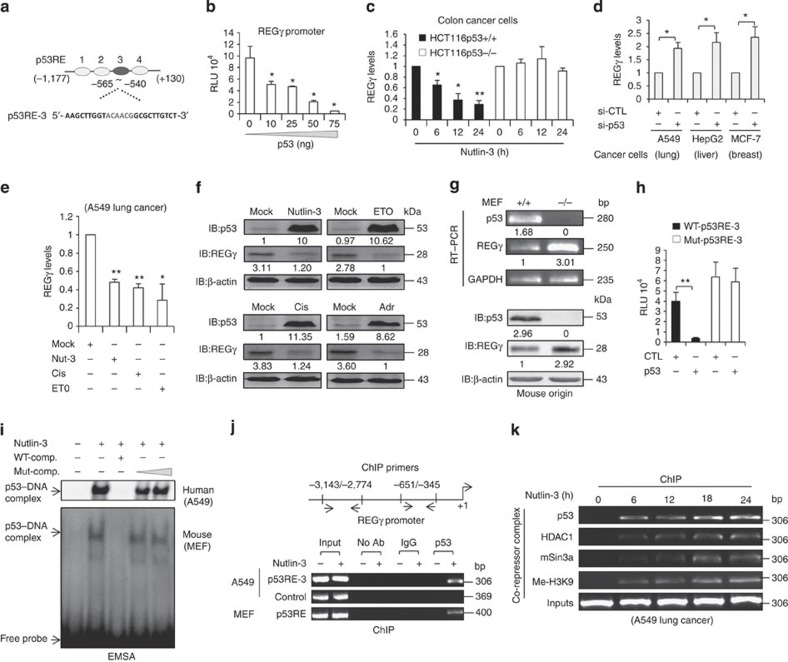
Figure 1.
(a) Schematic representation of putative p53-responsive elements (p53REs) with 1.3 kb region of the REGγ promoter. Dark grey colour represents critical p53RE-3. (b) H1299 cells were co-transfected with REGγ reporter construct along with an empty vector or increasing amounts of p53 for 24 h before lysis and were analysed for luciferase activity. The average was calculated based on three independent experiments. Error bars show the mean±s.d. from three technical replicates (two-tailed Student’s t-test, *P<0.05). (c) HCT116 p53 (+/+) and HCT116 p53 (−/−) were treated with 10 μmol l−1 Nutlin-3 for indicated time points to perform quantitative RT–PCR analysis. The average was calculated based on three independent experiments. Data are representative of three technical repeats with mean±s.d. (two-tailed Student’s t-test, *P<0.05, **P<0.005). (d) A549, HepG2 and MCF-7 cells were transfected independently with siRNA specific for p53 (20 nM for 48 h) and total RNA was isolated. Data represent average of three independent experiments. Data show the mean±s.d. from three technical replicates (two-tailed Student’s t-test, *P<0.05). (e,f) A549 cells were treated with different anticancer drugs such as Nutlin-3 (10 μmol l−1), Cisplatin (5 μg ml−1), ETO (10 μmol) and Adriamycin (1 μM), and were analysed by (e) RT–PCR and by (f) western blotting. (e) Error bars show the mean±s.d. from three technical replicates. (Two-tailed Student's t-test, *P<0.05, **P<0.005). (g) Comparative analysis of REGγ mRNA and protein levels in mouse embryonic fibroblast (MEF) p53 (+/+) and MEF p53 (−/−) cells. (h) H1299 cells were co-transfected with wild-type (2 μg) or mutated p53RE (2 μg) REGγ luciferase reporter constructs along with the p53 plasmid (75 ng) for 24 h and then analysed for luciferase activity. Data are representative of three independent experiments. Error bars show the mean±s.d. from three technical replicates. (two-tailed Student’s t-test, **P<0.005). (i) A549 cells (upper panel) and MEF cells (lower panel) were treated with Nutlin-3 for 24 h, and EMSA assays were performed with the double-stranded oligonucleotides containing the p53RE from the REGγ promoter. (j) Schematic representation of ChIP primers. A549 cells (upper two panels) and MEF cells (lower panel) were independently treated with Nutlin-3a for 24 h, and ChIP assays were performed with anti-p53 antibody. (k) ChIP analysis of REGγ promoter in A549 cells at indicated time periods after Nutlin-3 (10 μmol l−1) treatment.

