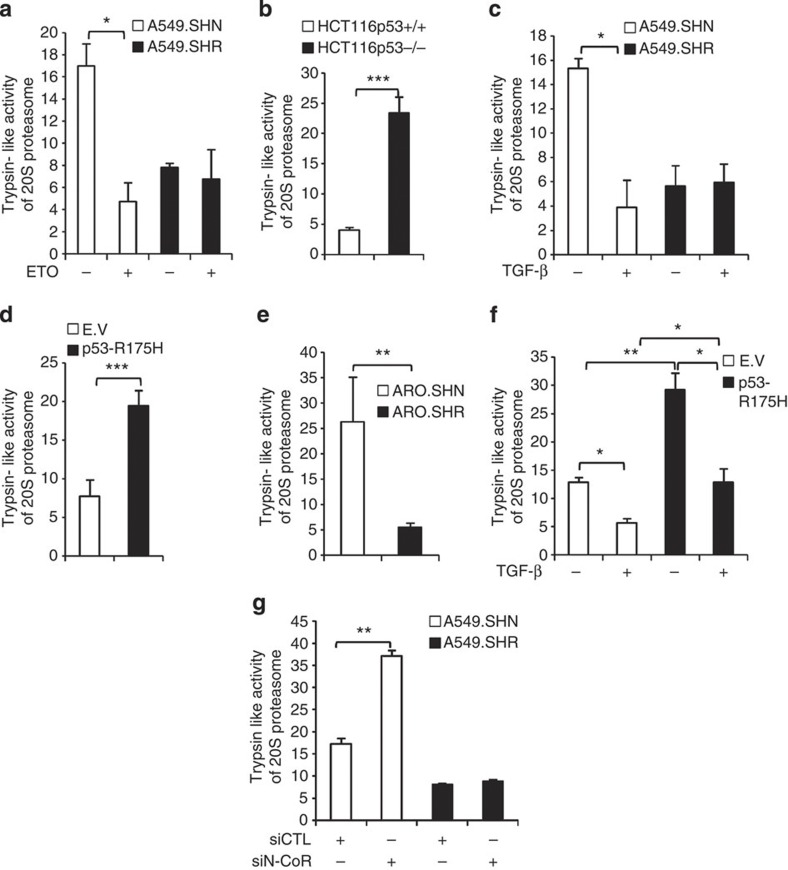
Figure 6. Regulation of proteasome pathway by p53/TGF-β via REGγ in cancer cells.
(a) p53 suppresses 20S proteasome activity via REGγ. A549 cells were treated with ETO (10 μM) for 24 h and were analysed for trypsin-like activity of 20S proteasome. Data are representative of three biological repeats with mean±s.d. (two-tailed Student’s t-test, *P<0.05). (b) p53−/− cells shows higher 20S proteasome activity. HCT116p53+/+ and HCT116p53−/− were compared for analysis of 20S activity. Data are representative of three biological repeats with mean±s.d. (two-tailed Student’s t-test, ***P<0.0005). (c) TGF-β inhibits 20S proteasome pathway via REGγ. A549 cells were treated with 5 ng ml−1 TGF-β for 24 h and trypsin-like activity of 20S proteasome was determined. Data are representative of three biological repeats with mean±s.d. (two-tailed Student’s t-test, *P<0.05). (d) Mutant p53 enhances 20S proteasome pathway via REGγ. H1299 cells stably expressing empty vector (E.V) and p53-R175H were compared for trypsin-like activity of 20S proteasome. Data are representative of three biological repeats with mean±s.d. (two-tailed Student’s t-test, ***P<0.0005). (e) Knockdown of REGγ decrease 20S proteasome activity in ARO colon cancer cell lines. Comparison of proteasome activity in control (ARO.SHN) and (ARO.SHR) REGγ-depleted cell lines. Error bars show the mean±s.d. from three technical replicates (two-tailed Student’s t-test, **P<0.005). (f) Attenuation of TGF-β inhibited proteasome activity by mutant p53. H1299 cells stably expressing E.V and mutant p53-R175H were left untreated or treated with 5 ng ml−1 TGF-β for 24 h and then analysed by proteasome assay. Error bars show the mean±s.d. from three technical replicates (two-tailed Student’s t-test, *P<0.05, **P<0.005). (g) Depletion of N-CoR enhances the proteasome pathway. A549 control and knockdown cell lines were transfected with control siRNA or siRNA targeting N-CoR for 72 h and then analysed for proteasome activity. Error bars show the mean±s.d. from three technical replicates (two-tailed Student’s t-test, **P<0.005).

