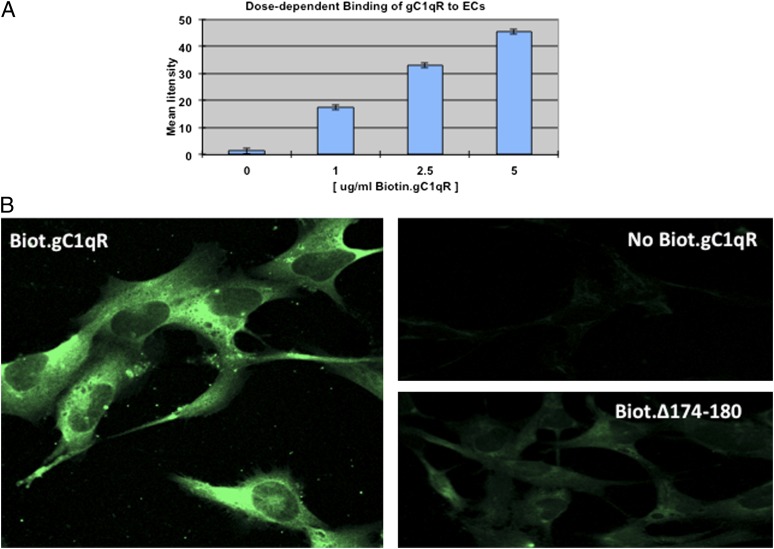
FIGURE 2.
sgC1qR binds to ECs. (A) Cells were stained with biotinylated gC1qR (ranging from 0 to 5 μg/ml), and the fluorescence intensity of each staining (n = 2) was plotted to show dose dependence. (B) The comparative immunofluorescence staining between biotinylated gC1qR (5 μg/ml) and biotinylated gC1qR deletion mutant lacking residues 174–180 (Δ174–180). Original magnification ×68. The negative control was ECs incubated with 5 μg/ml unbiotinylated gC1qR.

