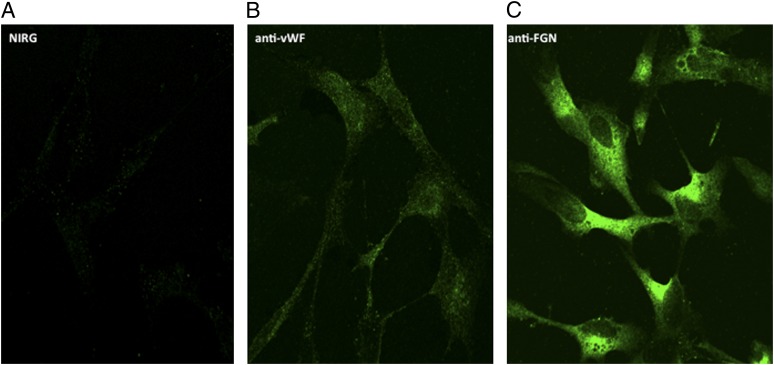
FIGURE 9.
Comparison of the expression of FGN and vWF on EC surface. Cells were grown on cover slips and incubated with 5 μg/ml anti-FGN (C), anti-vWF (B), or species-matched IgG (A). The bound Ab was visualized using Alexa Fluor 488–F(ab′)2 secondary Ab, as described in Materials and Methods. Original magnification ×68.

