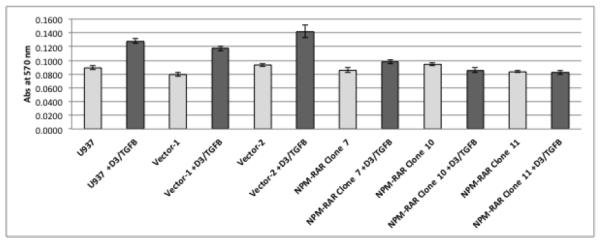
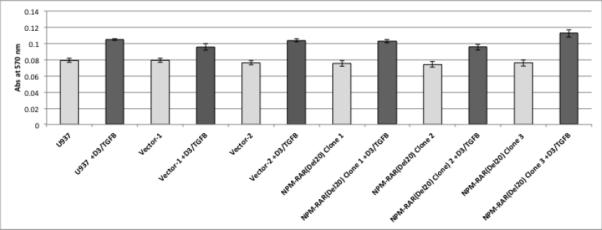
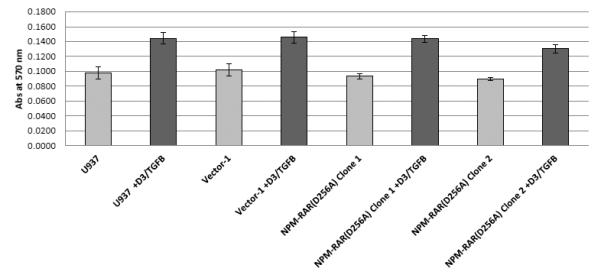
Figure 6.


NBT Staining. Cells were grown in medium with or without 250 ng/ml Vitamin D3 and 1 ng/ml TGFbeta for 5 days, and acquisition of oxidases assessed by NBT assay. Each data point represents the mean of one experiment done in triplicate +/− SD; each experiment was performed twice, with similar results. A. NPM-RAR B. NPM-RAR(Del20) C. NPM-RAR(D314A)
