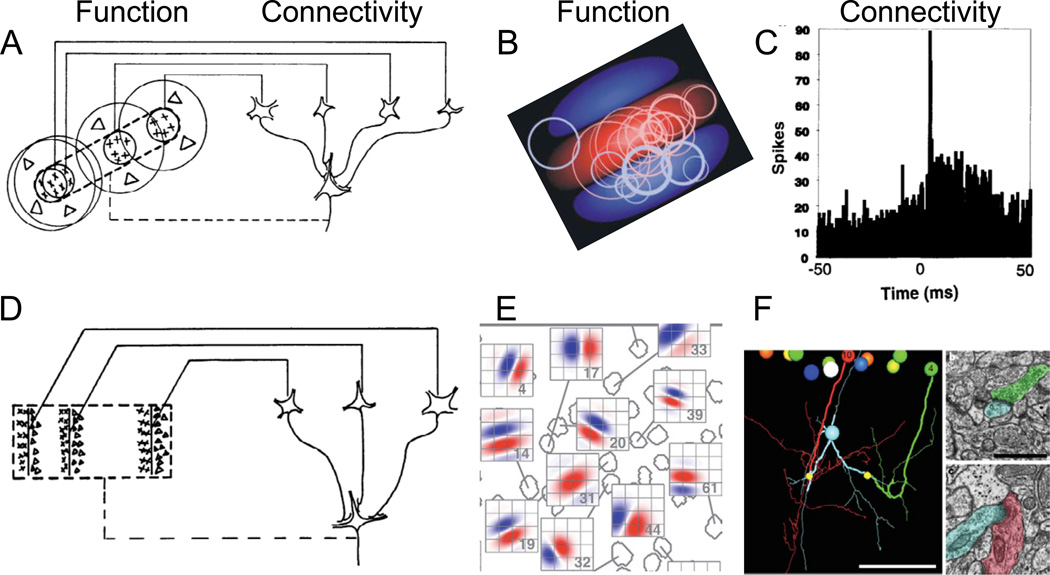
Figure 1. Hubel and Wiesel’s receptive-field models and some strategies for testing them.
(A) Hubel and Wiesel‘s simple-cell model. The simple cell receives convergent input from multiple LGN cells (Connectivity) whose receptive fields (Function) are of the same sign (in this example, on-center) and are aligned in visual space. As a result, the simple cell has a receptive field with an elongated on subregion (indicated by the interrupted lines in the receptive-field diagram) flanked by two off subregions. From Hubel and Wiesel (1962). (B,C) Experimental proof for the model from Reid and Alonso (1995). (B) Summary diagram showing the relationship between the receptive fields (Function) of monosynaptically connected pairs of neurons. Receptive field of each simple cell was transformed into a typical receptive field, shown with a central on subregion (red) flanked by two off subregions (blue). The circles indicate the relative size, sign and locations of the receptive fields of monosynaptically connected LGN cells. (C) Example of a ‘monosynaptic” cross-correlation between an LGN cell and a simple cell (Connectivity). Note the sharp peak at +4 msec, indicating in increase in the probability that the cortical cell fired 4 msec after LGN firing. (D) Hubel and Wiesel‘s complex cell model. (E, F) A theoretical example of how the model might be examined. (E) Simple receptive fields can be mapped with two-photon calcium imaging. Receptive field diagrams (red = on subregion, blue = off subregion) corresponding to different cells (gray outlines) in mouse visual cortex (Bonin et al., 2011). (F) Example of functional connectomics, from a different study of excitatory inputs onto inhibitory neurons (Bock et al., 2011). The axons of a group of neurons with different orientation tunings (coded by different colors) were reconstructed. Axons of vertically and horizontally tuned neurons (red and green) descend and make synapses (small yellow balls) onto dendrites of an inhibitory interneuron (cyan). Insets: electron micrographs showing the synapses onto the inhibitory neuron from cell 4 (b) and cell 10 (c) with corresponding colors overlaid.

