
Figure 4. Intravascular NIRF imaging of protease inflammation in experimental atherosclerosis.
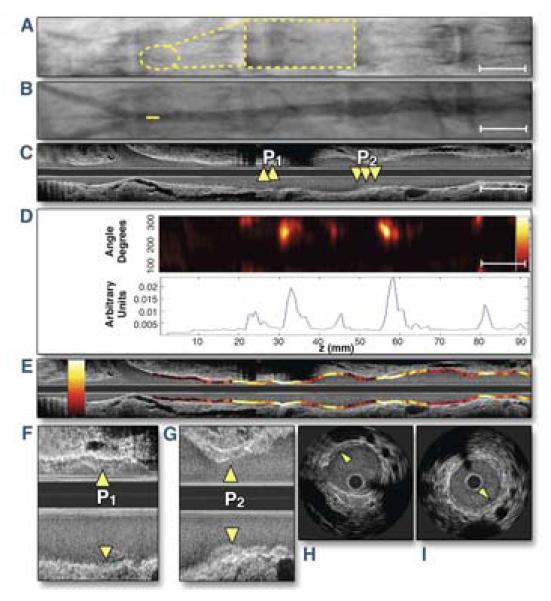
(A, B) Fluoroscopic and angiographic images (A, yellow dotted lines: high magnification inset of the radiopaque tip of the catheter; B, solid yellow line: intravascular catheter tip position) positioned in the rabbit aorta, proximal to the iliac bifurcation. (C) Co-registered longitudinal IVUS demonstrates mild aortic plaques P1 and P2. (D) NIRF catheter pullback aligned with images A through C reveals NIRF protease activity at mild plaques (top) with 1-dimensional angle-averaged NIRF plot (bottom). (E) Superimposed longitudinal IVUS and NIRF fusion images (NIRF scale bar: yellow/white=strong, red/black=weak). (F, G) Longitudinal and (H, I) axial images of plaques P1 and P2. Reproduced with permission from (18).