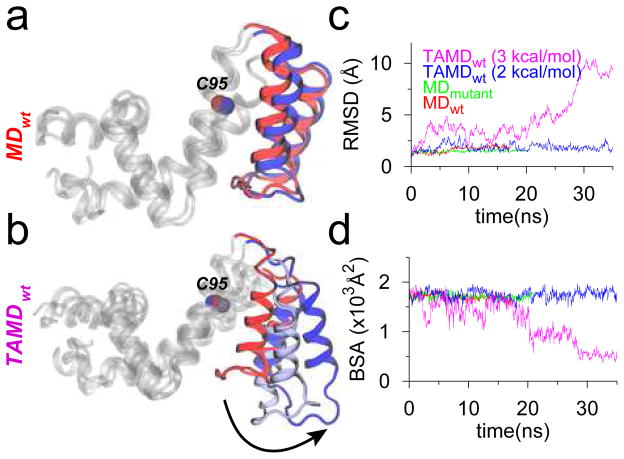
Figure 2.
MD and TAMD simulation data for RGS4 runs with initial coordinates from PDB code 1AGR. (a and b) Overlay of cartoon representations of apo-RGS4 (red, beginning; blue, end of simulations). All helices of RGS4, except the α5-α6 pair, are shown in white cartoons. (c) The Cα -RMSD traces with reference to starting conformations. (d) Buried surface area (BSA) between the α5-α6 helix pair and the rest of RGS4.

