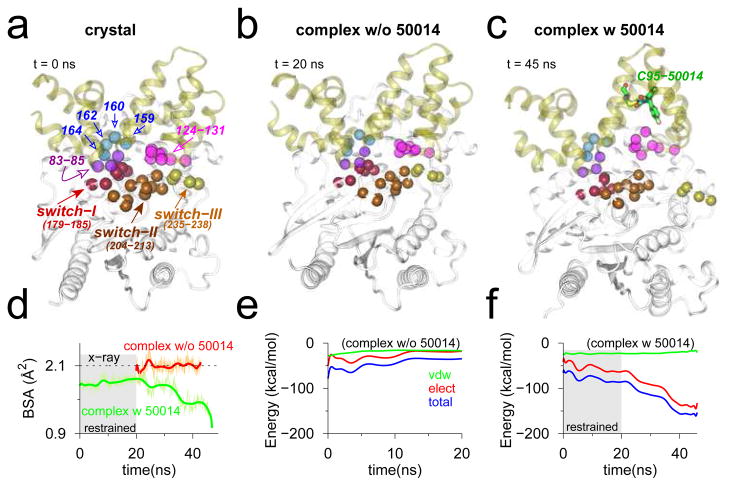
Figure 8.
Snapshots of RGS4-Gα complex in (a) crystallographic conformation (PDB code 1AGR); and conformations at the end of MD equilibrations without (b) and with (c) inhibitor. The Cα -atoms of key interacting residues in the RGS4-Gα interface are labeled (panel a), and rendered as space-filling spheres in each snapshot. (d) Traces of BSA between RGS4 and Gα in the complex (green, with inhibitor; and red, without inhibitor). (e–f) Traces for non-bonded interaction energy and its components computed between residues of RGS4 and Gα (see panel a) from MD simulations without (panel e) and with (panel f) inhibitor. (Gray background in panels d and f) The first 20 ns of restrained MD simulation with inhibitor. See Figure S15 for additional snapshots from the inhibitor-bound simulation. The red trace in panel d is deliberately shifted by 20 ns to highlight the fact that simulation was not restrained.

